Manage your virtual machines from the web client (VMware vSphere Client) on VMware vSphere 6.7
- VMware
- 17 July 2024 at 12:55 UTC
-

- 2/2

3. Monitor the virtual machine
In the "Monitor" tab of each virtual machine, you can:
- see the problems and alarms that have been triggered for it.
- get performance graphs for different system resources.
- see the tasks and events that occurred on it.
- obtain information regarding the use of processor, memory, ... thereof.
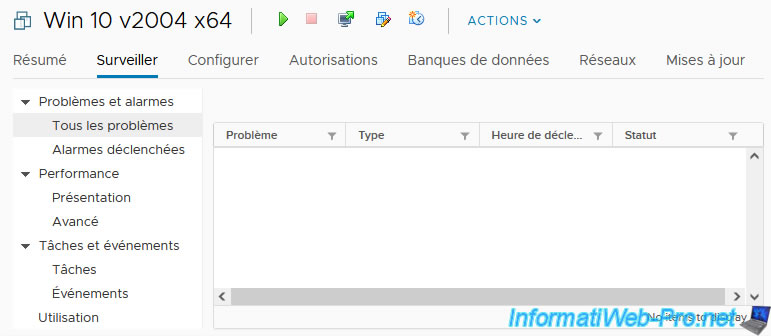
To begin, in the "Issues and Alarms -> All Issues" section, you will be able to see the different problems that may have occurred on your virtual machine.
In this list, you will see in particular the alarms that have been triggered.
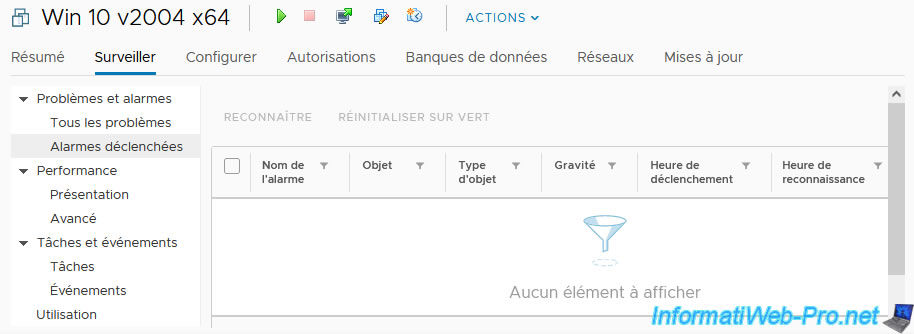
In the "Issues and Alarms -> Triggered Alarms" section, you will be able to see the list of alarms that have been triggered for this virtual machine.
For each alarm triggered, you will find its name, the object concerned by this alarm, ...
For more information regarding this "Alarms triggered" section, refer to our tutorial: VMware vSphere 6.7 - Create and manage alarms.
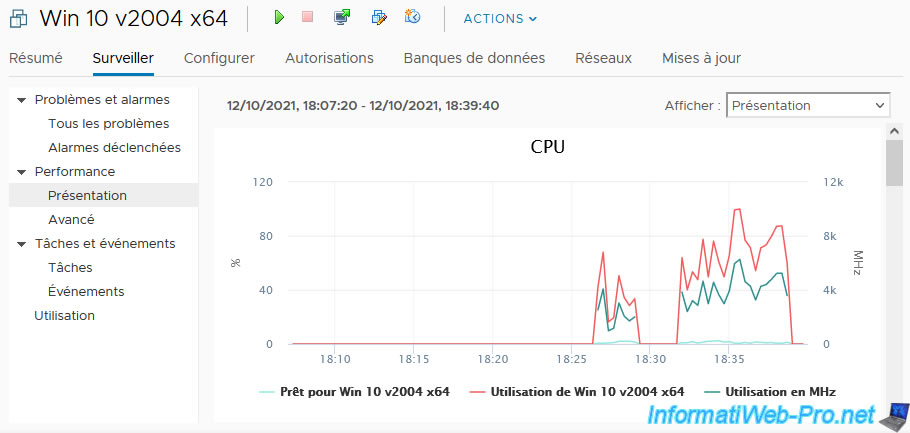
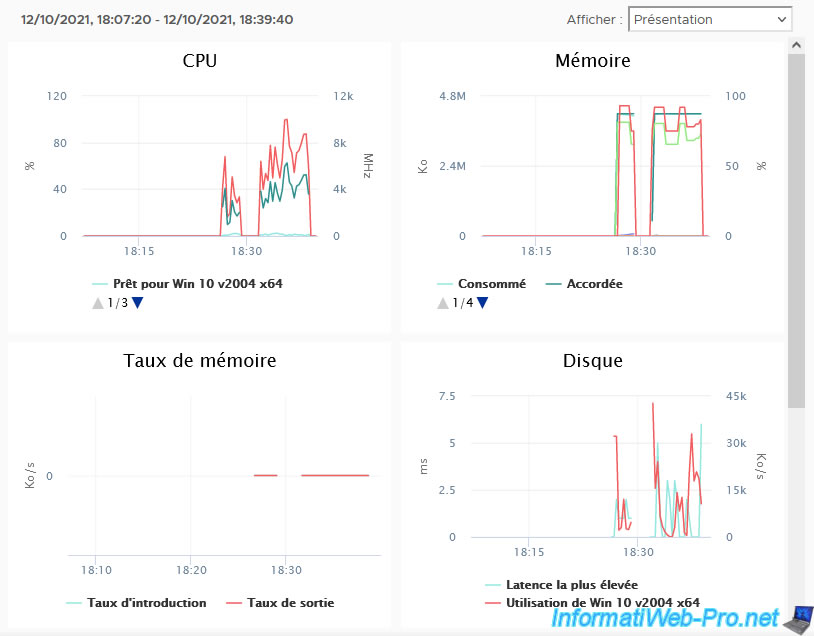
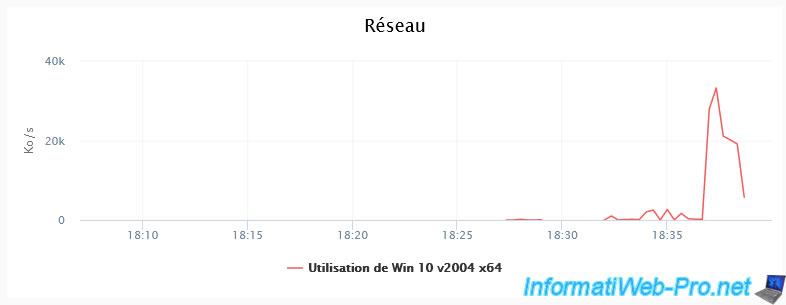
In the "Performance -> Overview" section, you will be able to get performance graphs regarding CPU, memory, disk and network usage.
Via the menu displayed at the top right, you can also obtain performance graphs concerning:
- Space: space used on the datastore concerned by this virtual machine.
- Space Utilization: a first diagram indicates what percentage of space is used for virtual hard disks, snapshots, etc.
A 2nd diagram indicates how the space used by the virtual machine is distributed across the different datastores. - Network Adapters: network speed currently used and number of packets received and transmitted.
- Disks: read and write usage rate of the different virtual and physical hard disks (where the virtual hard disks are located), as well as the number of disk requests (virtual and physical) for writes and reads.
Note that VMware vCenter Server allows you to go back to the previous day, to last week, to last year, ... unlike VMware ESXi which only allowed you to get charts for the last hour.
To do this, use the menu located at the top left (to the left of the interval displayed above the graphs).
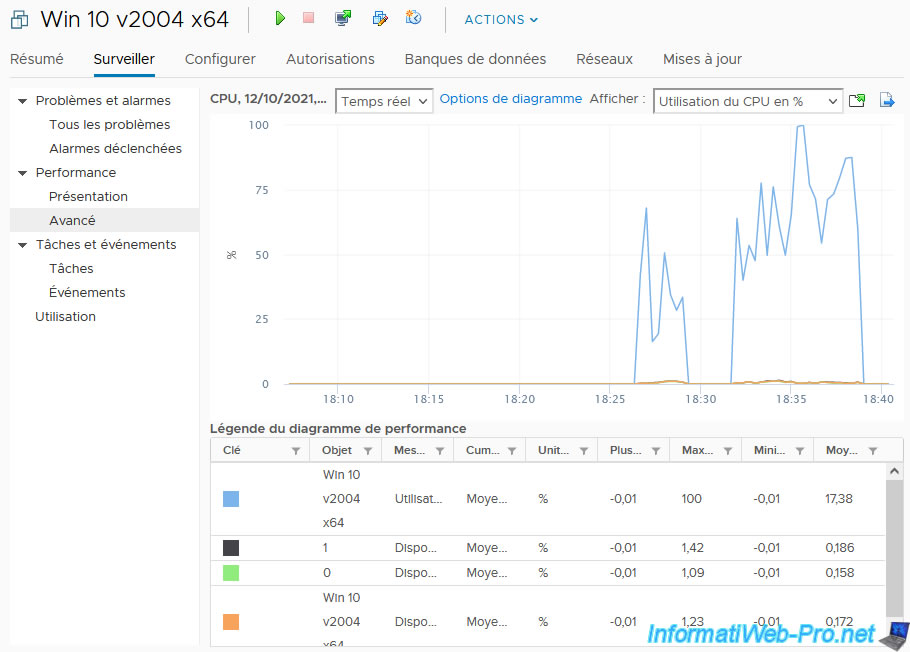
In the "Performance -> Advanced" section, you will be able to obtain performance charts for:
- CPU usage in % or MHz
- the availability of the physical CPU for this virtual machine
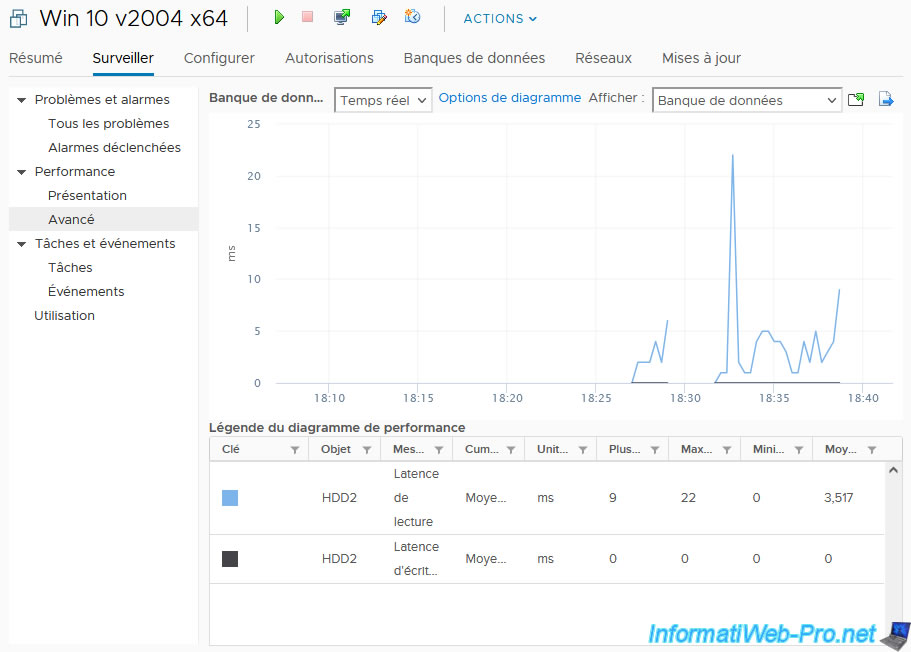
- the delay in milliseconds (ms) for read and write access to your datastore
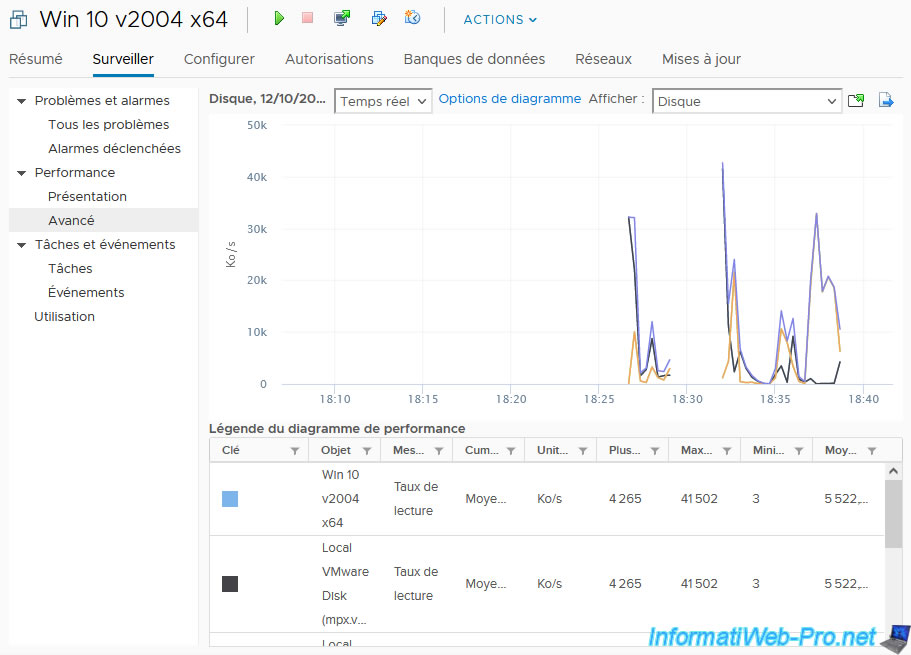
- the disk read and write rate for your virtual machine, as well as per disk
- the amount of memory used
- network usage (reception and transmission)
- power consumption (in watts)
- know the latency in milliseconds (ms) for each virtual hard disk of the virtual machine
Below the desired chart, you will also find a table with different values related to the selected chart.
As with other graphs, you will have the ability to view these performance graphs in real time, as well as go way back in time (if you wish).
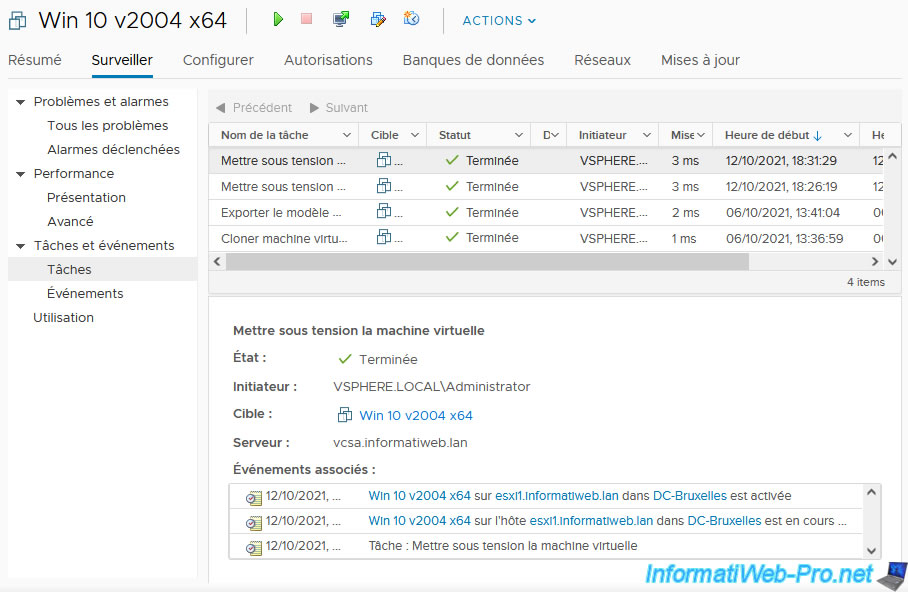
In the "Tasks and Events -> Tasks" section, you will find the list of tasks that have been executed or are currently running for this virtual machine.
Such as: powering on, cloning, exporting, ...
For more information about tasks, refer to our tutorial: VMware vSphere 6.7 - Tasks and events.
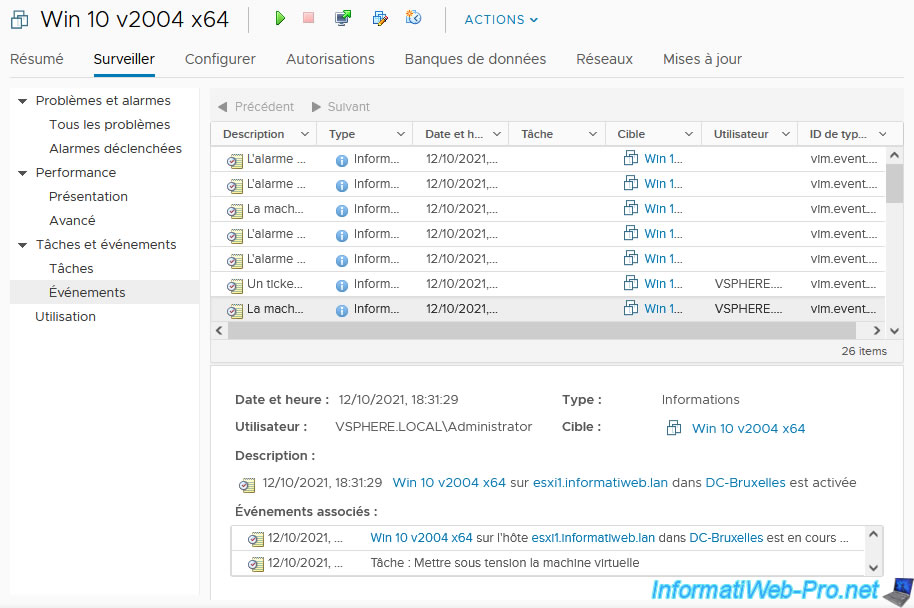
In the "Tasks and Events -> Events" section you will find the list of events that occurred on this virtual machine.
For example: powering on this virtual machine, stopping its guest operating system, reconfiguring its virtual hardware and/or its settings, ...
For more information about events on VMware vCenter Server, refer to the tutorial cited previously for tasks.
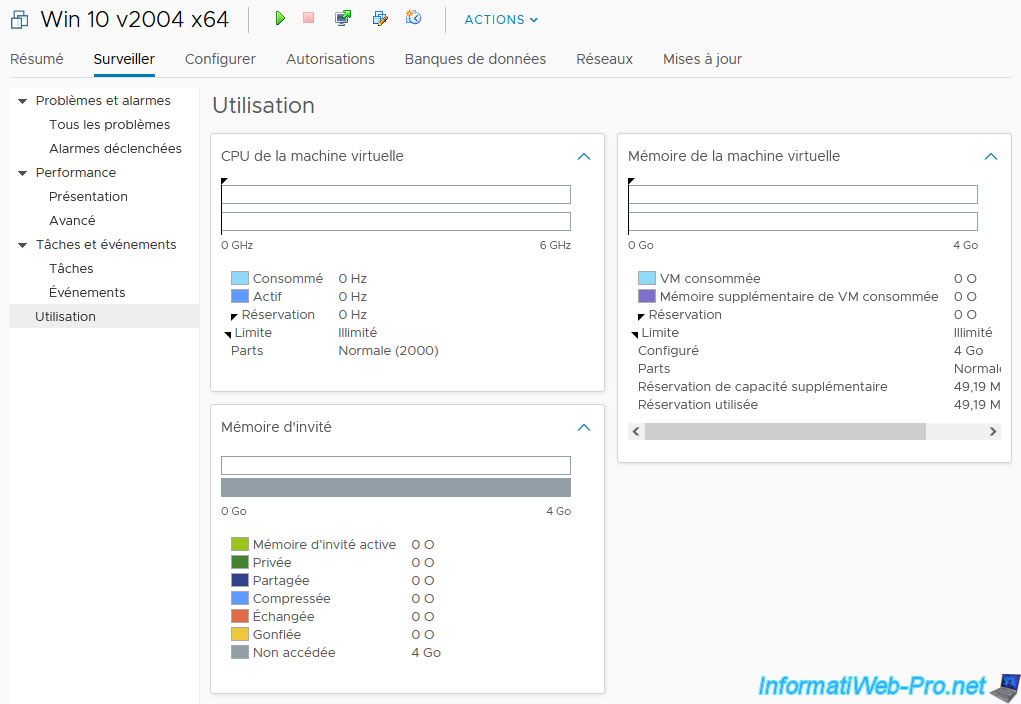
Finally, in the "Usage" section, you will be able to monitor the use of:
- Virtual Machine CPU: allows you to see the virtual machine's CPU usage.
- Virtual Machine Memory: allows you to see the amount of RAM used on the host by this virtual machine.
- Guest Memory: allows you to see the amount of RAM used in the guest operating system.
For the "Virtual Machine CPU" section, you will be able to see:
- Consumed: the frequency currently consumed for the virtual machine's processor
- Active: Estimate the CPU usage of the virtual machine IF there is no resource usage conflict with other virtual machines. Additionally, if a limit has been set for the virtual CPU of this virtual machine, the "active" value will not exceed this limit.
- Reservation: the minimum frequency that you have reserved for this virtual machine via the "Reservation" parameter of its virtual CPU. Which means that this machine will always be able to use at least this frequency (part) of the host's physical processor.
- Limit: unlimited by default. Unless you have set a limit in your virtual machine's virtual CPU settings. In this case, the virtual processor of the virtual machine will never exceed the frequency indicated here as the limit.
- Shares: indicates the relative priority for sharing the "processor" system resource for this virtual machine.
For the "Virtual Machine Memory" section, you will be able to see:
- VM Consumed: amount of host RAM allocated to this virtual machine.
- VM Overhead Consumed: amount of additional RAM used by VMware ESXi for its data structures and its own code for this virtual machine. This value is often expressed in MB and depends on the amount of RAM and the number of virtual processors/cores allocated to your virtual machine.
- Reservation: amount of RAM that you have reserved for this virtual machine so that it can always use at least this amount of RAM.
- Limit: unlimited by default. Unless you have set a limit so that this virtual machine cannot use more than x MB or GB of RAM.
- Configured: amount of RAM you have allocated to your virtual machine.
- Shares: indicates the relative priority used for sharing the system resource "random access memory (RAM)" for this virtual machine.
- Overhead Reservation: amount of additional RAM reserved by the hypervisor (VMware ESXi) for this virtual machine for its data structures necessary for the execution of this virtual machine.
- Used Reservation: same as the previous option.
For the "Guest Memory" section, you will be able to see:
- Active Guest Memory: amount of RAM currently used by the virtual machine's guest operating system.
- Private: amount of memory currently stored in the host's RAM.
- Shared: memory shared by multiple virtual machines using Transparent Page Sharing (TPS).
- Compressed: amount of memory compressed by the VMkernel.
- Swapped: amount of guest memory swapped and reclaimed by the VMkernel when the memory needed by this virtual machine is insufficient. It is important to know that this process significantly affects the performance of your virtual machine. Preferably, this value should therefore remain equal to 0.
- Ballooned: amount of memory obtained via the memory bloating driver (vmmemctl).
- Unaccessed: amount of memory that the virtual machine never accesses, which is mostly free space in the guest operating system's RAM.
For more information about RAM management under VMware ESXi, see VMware's "Understanding Memory Resource Management in VMware® ESX™ Server" document.
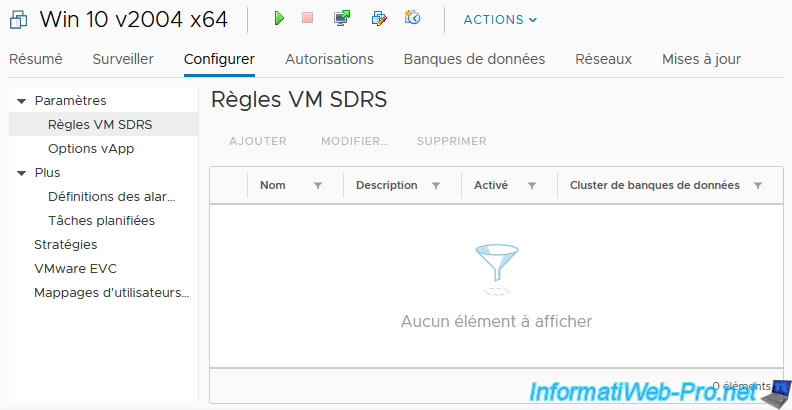
4. Configure the virtual machine
In the "Configure" tab of each virtual machine, you can:
- manage VM SDRS (Storage Distributed Resource Scheduler) rules
- manage vApp options that will be stored in the exported OVF template
- view and manage alarm definitions for your virtual machine
- view and manage scheduled tasks for your virtual machine
- manage VM storage policies for your virtual machine
- enable or disable EVC (Enhanced vMotion Compatibility) mode
- manage SSO user mappings on the guest operating system
In the "Settings -> VM SDRS Rules" section, you will be able to manage the VM SDRS (Storage Distributed Resource Scheduler) rules allowing you to choose whether the virtual hard disks of this virtual machine should be stored on the same datastore or on different datastores.
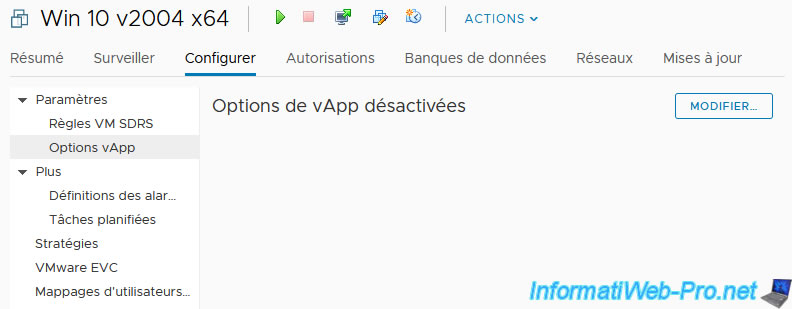
In the "Settings -> vApp Options" section, you will be able to enable and configure vApp options.
In summary, this section allows you to configure different parameters that will be included in the OVF template when you want to export this virtual machine as an OVF template (via the menu: Actions -> Template -> Export OVF Template).
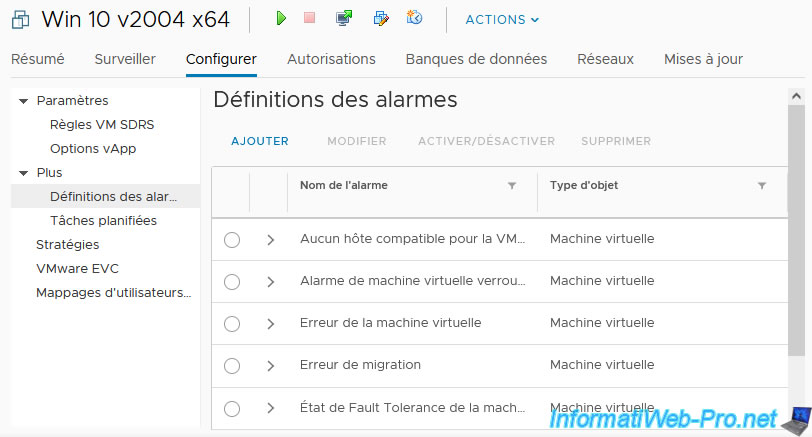
In the "More -> Alarm Definitions" section, you will be able to see the alarm definitions existing by default for virtual machines (inherited from your "vCenter Server").
You can also add some for this virtual machine. However, only the alarm definitions added to this virtual machine will be modifiable from this list.
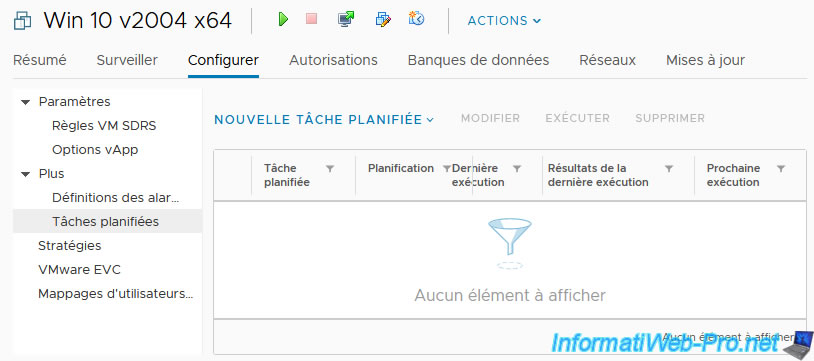
In the "More -> Scheduled Tasks" section, you will be able to create new scheduled tasks to schedule:
- powering on (starting) this virtual machine
- shut down or restart the guest operating system
- pause this virtual machine
- and more
For more information on creating these scheduled tasks, refer to our tutorial: VMware vSphere 6.7 - Scheduled tasks.
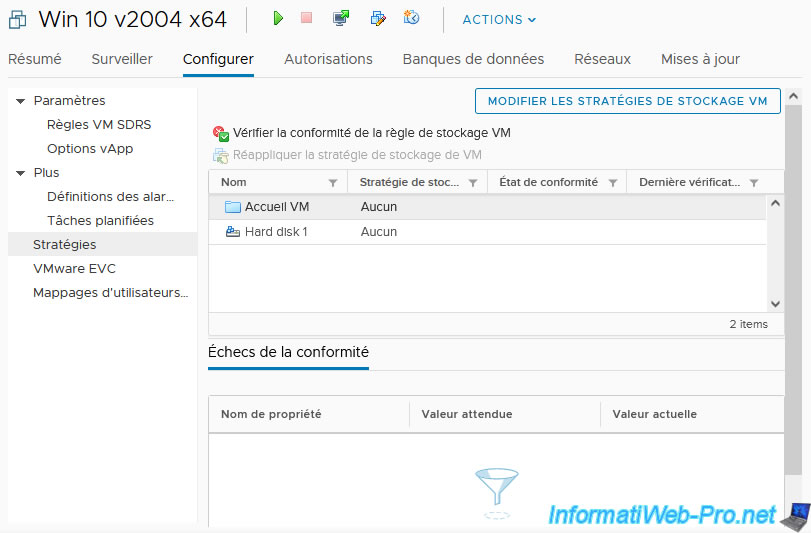
In the "Policies" section, you will be able to manage the VM storage policies allowing you to select the datastore adapted to your needs for the virtual machine and its virtual hard disks.
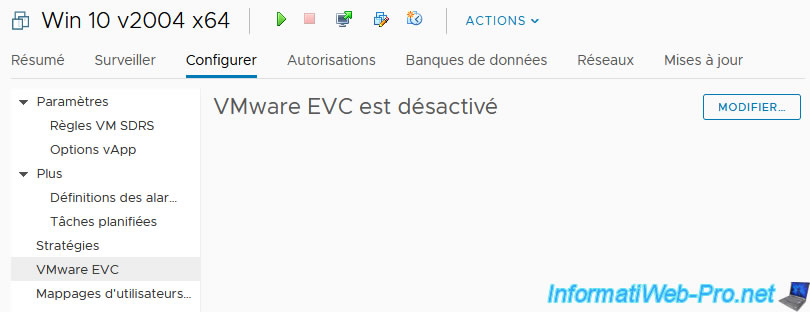
In the "VMware EVC" section, you can enable and configure the "VMware EVC (VMware Enhanced vMotion Compatibility)" mode to resolve compatibility issues that arise when you try to migrate a virtual machine between 2 hosts with a different processor (or more precisely with different features).
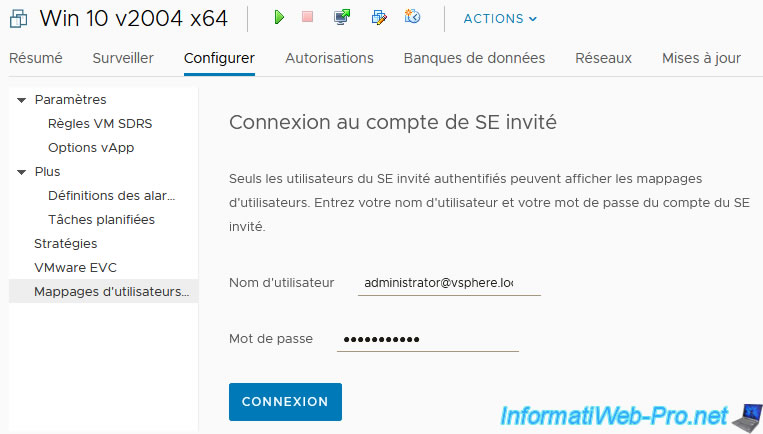
In the "Guest User Mappings" section, you will be able to manage SSO user mappings (eg: user@vsphere.local) for the guest operating system.
These SSO user mappings allow you to grant administrative rights to these users on the guest operating system to allow them to upgrade VMware Tools in it, ...
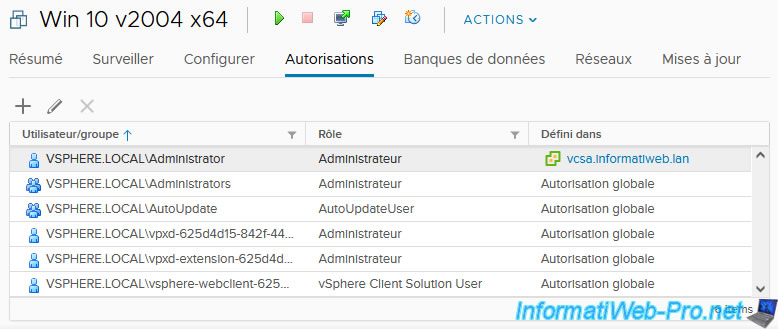
5. Manage permissions on a virtual machine
In the "Permissions" tab, you can grant rights to users or groups of users on this virtual machine.
To learn more about managing these permissions, refer to our tutorial: VMware vSphere 6.7 - Manage roles, users and permissions.
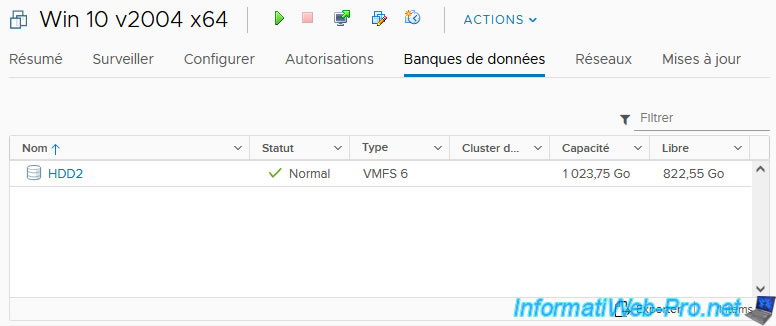
6. Datastores
In the "Datastores" tab, you will be able to see in which datastores your virtual machine is located (configuration file and virtual hard disks).
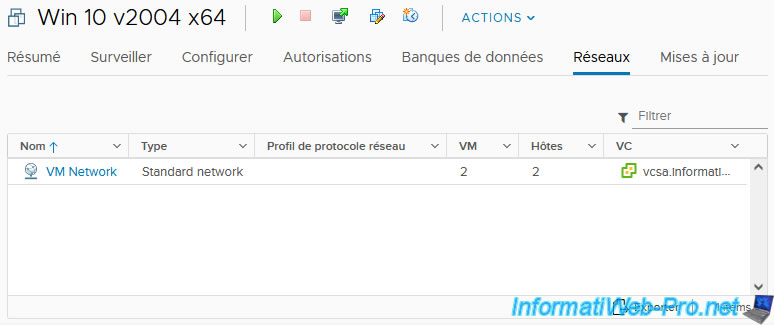
7. Virtual networks
In the "Networks" tab, you can find out which virtual networks this virtual machine is connected to.
The default virtual network to which virtual machines are connected is: VM Network.
For each virtual network in the list, you will find:
- Name: his name. Corresponds by default to the name of the port group located on the VMware ESXi host added in the inventory of your "vCenter Server" server.
- Type: type of network used.
- Network protocol profile: name of the profile used for IP address allocation (statically or dynamically).
- VMs: number of virtual machines connected to this same virtual network. Whether they are currently powered on or not.
- Hosts: Number of VMware ESXi hosts where this virtual network (of the same name) is located.
- VC: name of the "vCenter Server" server where this virtual network is located.
8. Updates
Allows you to activate and upgrade the version of VMware Tools and virtual hardware of the virtual machine.
Also allows you to check if the current version of these matches the version of the VMware ESXi host.

Share this tutorial
To see also
-
VMware 3/13/2024
VMware ESXi 6.7 - Synchronize the clock of ESXi hosts from a time server (NTP)
-

VMware 3/8/2024
VMware ESXi 6.7 - Synchronize the clock of VCSA from a time server (NTP)
-
VMware 7/31/2024
VMware vSphere 6.7 - Add an Active Directory identity source
-
VMware 5/22/2024
VMware vSphere 6.7 - Change default console
No comment