Monitor your pfSense 2.6 firewall using the SNMP protocol and Zabbix 6
- Firewall
- pfSense
- 16 August 2025 at 07:45 UTC
-

- 2/4

3. Configure Zabbix 6 to monitor pfSense via SNMP
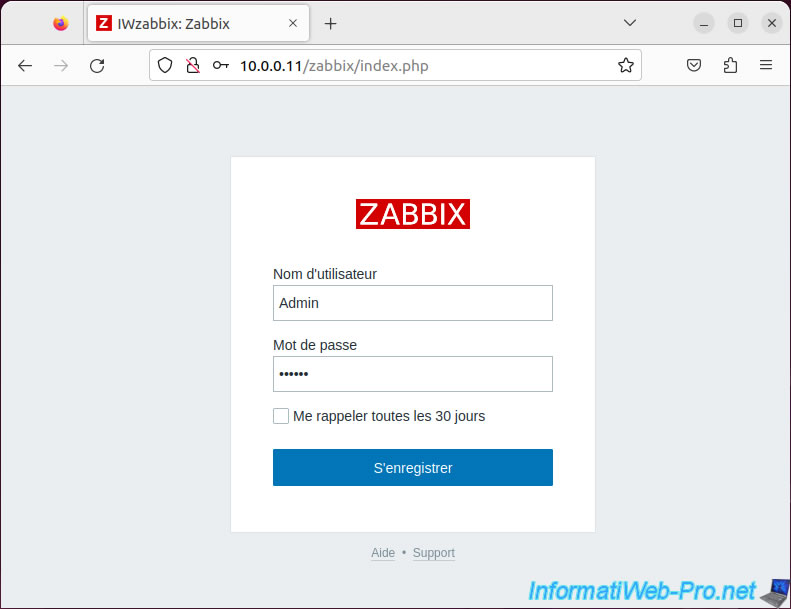
Once the initial setup via the wizard above is complete, you will be redirected to the Zabbix login page where you will need to log in as Admin.
The Zabbix login details are: Admin / zabbix.
Source : 1 Login and configuring user - Zabbix.
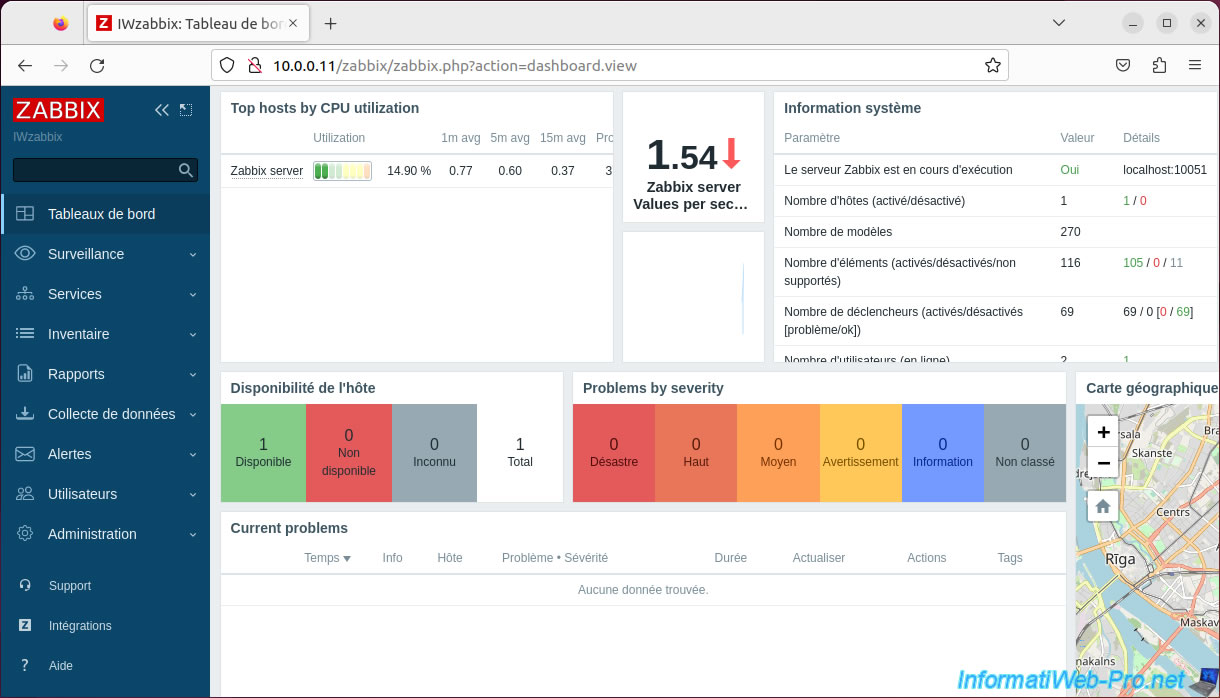
This is what the Zabbix web interface looks like by default.
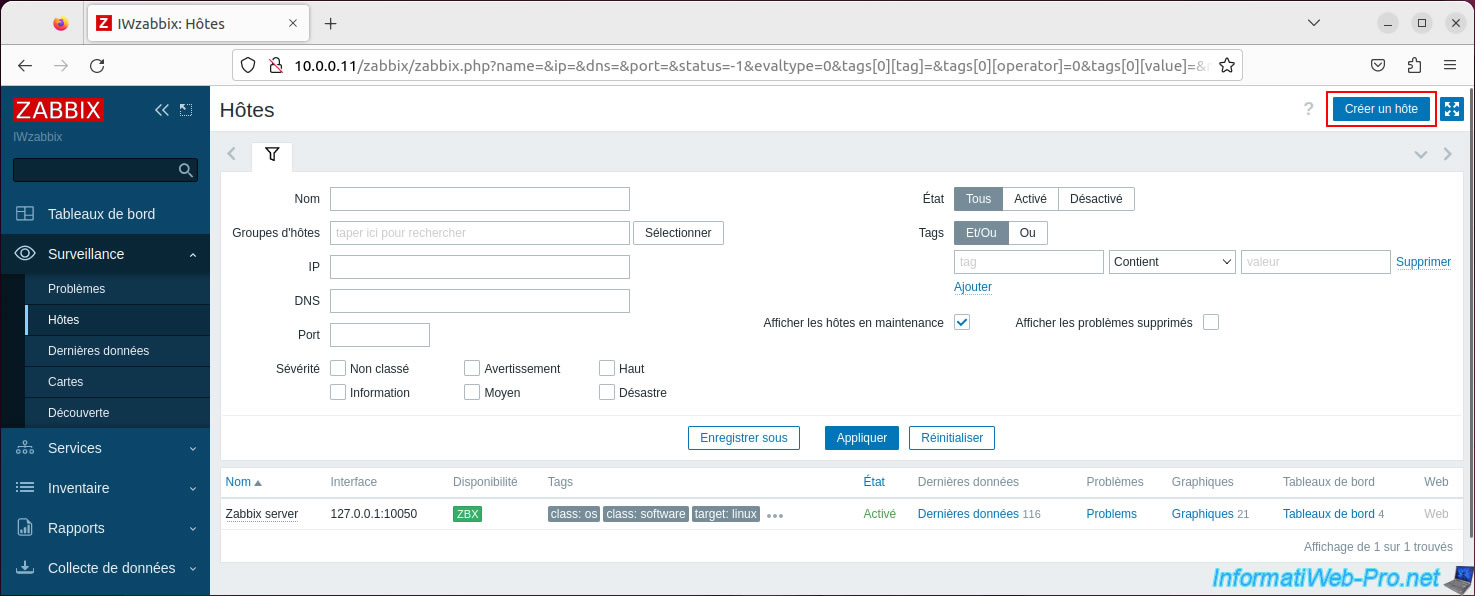
To monitor pfSense using Zabbix, go to "Monitoring -> Hosts" and click "Create host" (top right).
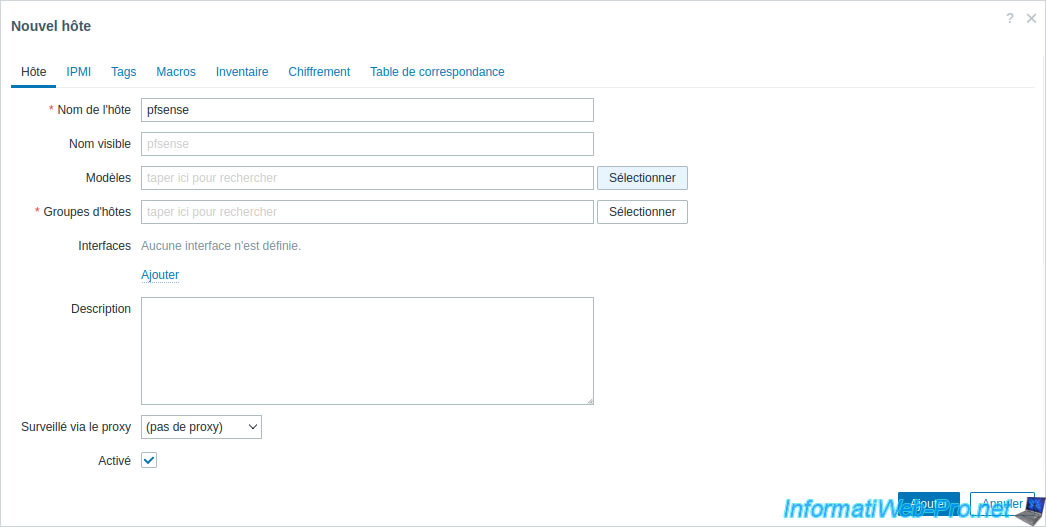
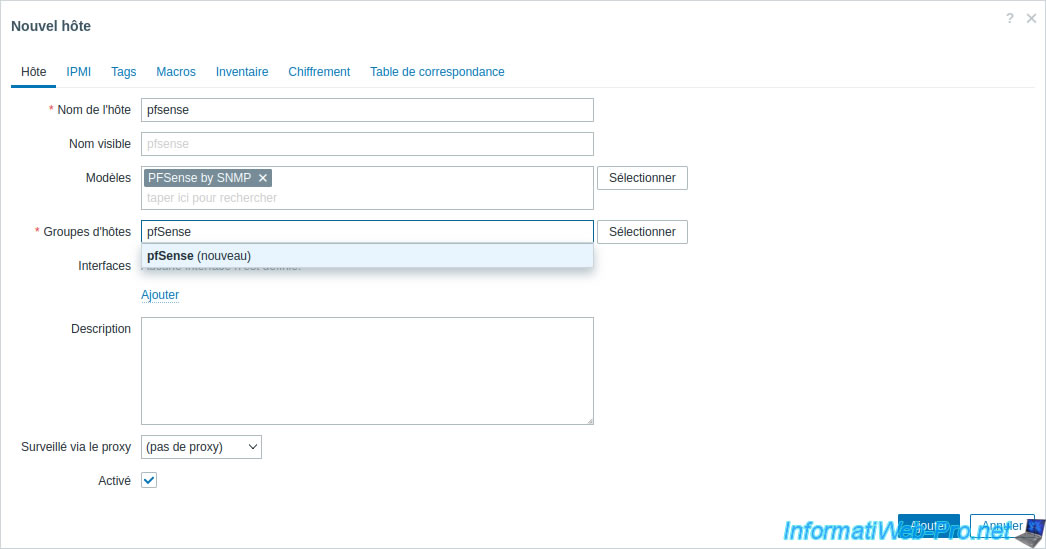
In the "New host" window that appears, indicate the host name of your "pfSense" machine as it is defined on pfSense (in its "System -> General Setup" menu) in the "Computer Name" box. host".
Then, indicate a different name for the name visible on Zabbix if you wish.
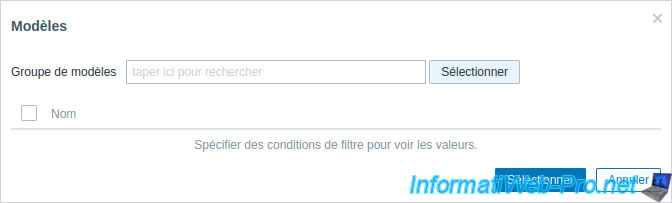
Next, click "Select" (to the right of "Templates").
In the "Templates" window that appears, click: Select.
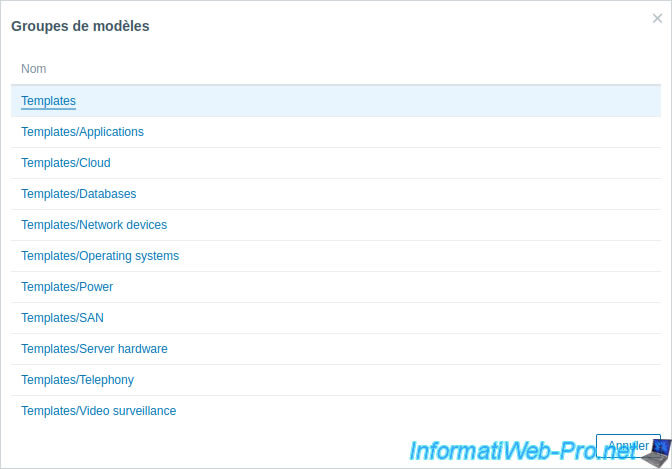
In the "Template groups" list that appears, click on: Templates.
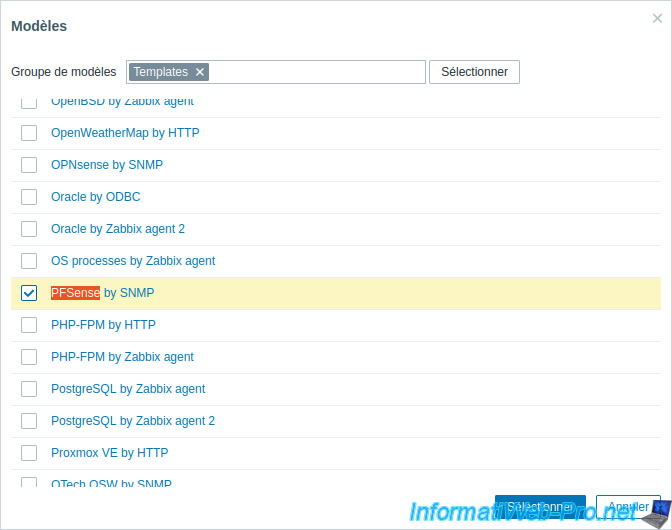
In the list that appears, check the "PFSense by SNMP" template and click: Select.
Note: if necessary, use the keyboard shortcut "CTRL + F" and search for "pfsense" to find it more quickly.
Then, type "pfSense" for example as host group and click "pfSense (new)".
Note: you can use existing host groups already on Zabbix or create new ones, it doesn't matter.
This simply allows several servers to be grouped together in the Zabbix interface.
To the right of "Interfaces", click on "Add -> SNMP".
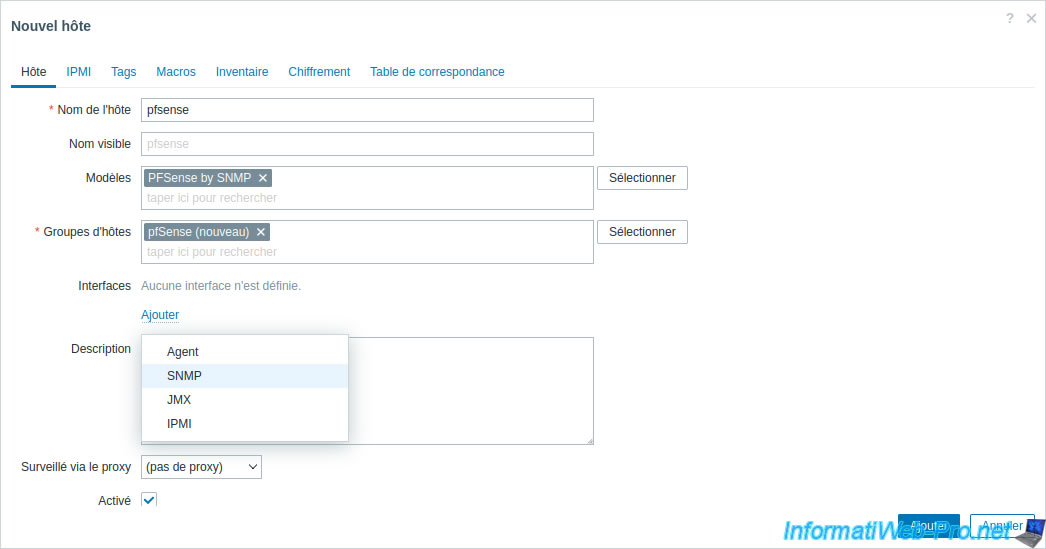
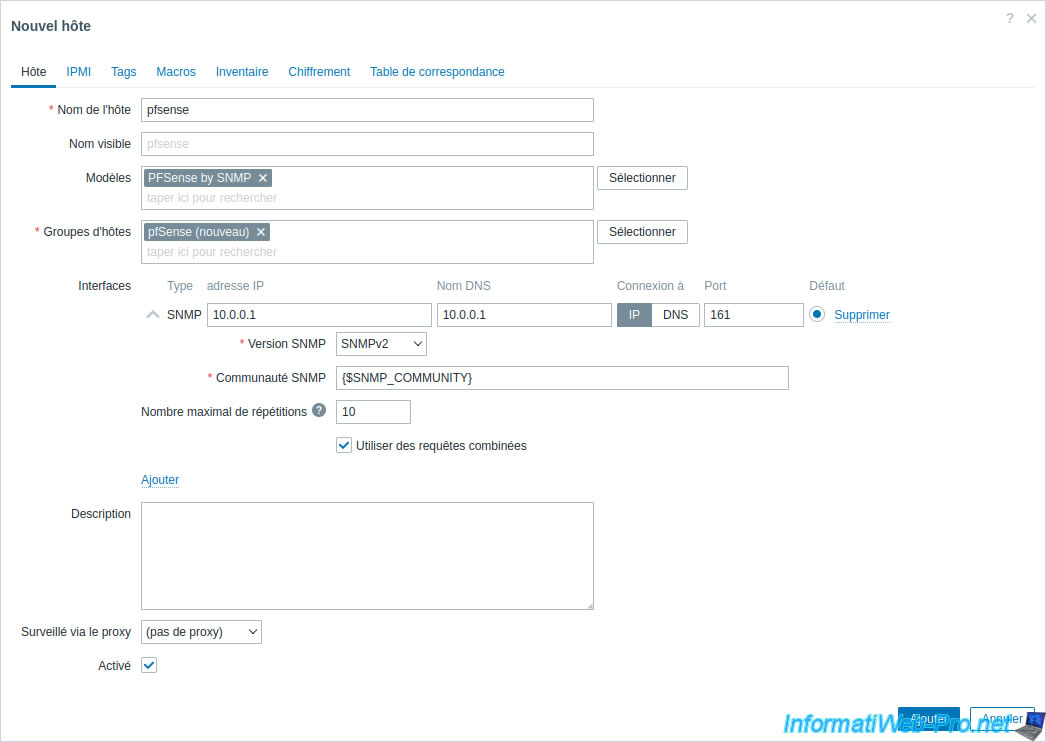
Provide the IP address of your pfSense machine, as well as its DNS name (if there is one). Otherwise, also indicate its IP address in the "DNS Name" box.
By default, SNMPv2 will be used (and supported by pfSense) and the SNMP community name used will be "public" (via the "{$SNMP_COMMUNITY}" macro).
Which corresponds to the SNMP community name specified by default on pfSense.
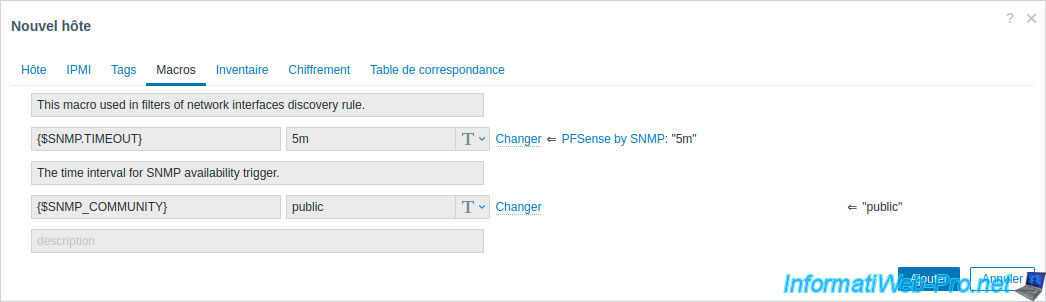
To see what the "{$SNMP_COMMUNITY}" macro is, go to "Macros -> Legacy and Host Macros".
As you can see, the corresponding value is "public".
Click Add.
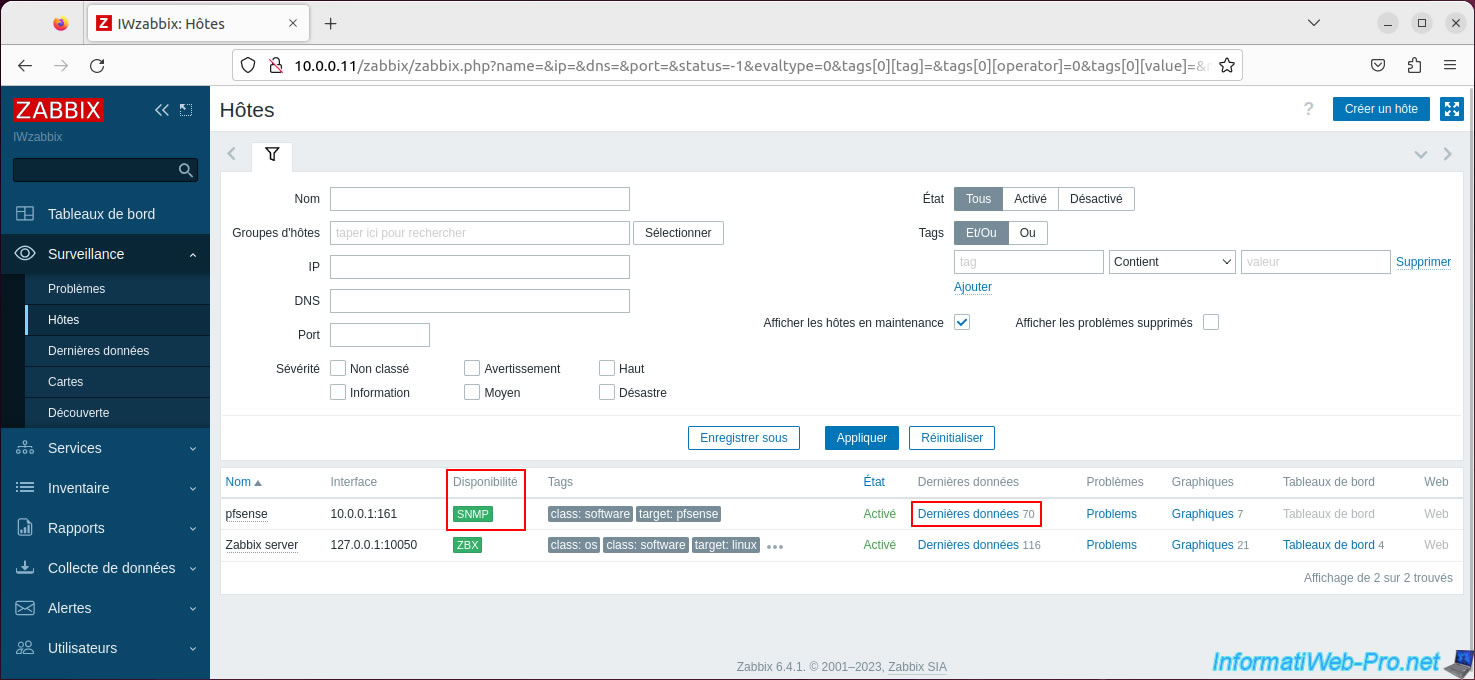
The "pfsense" host has been added.
As you can see, by default, SNMP availability is grayed out for the added host.
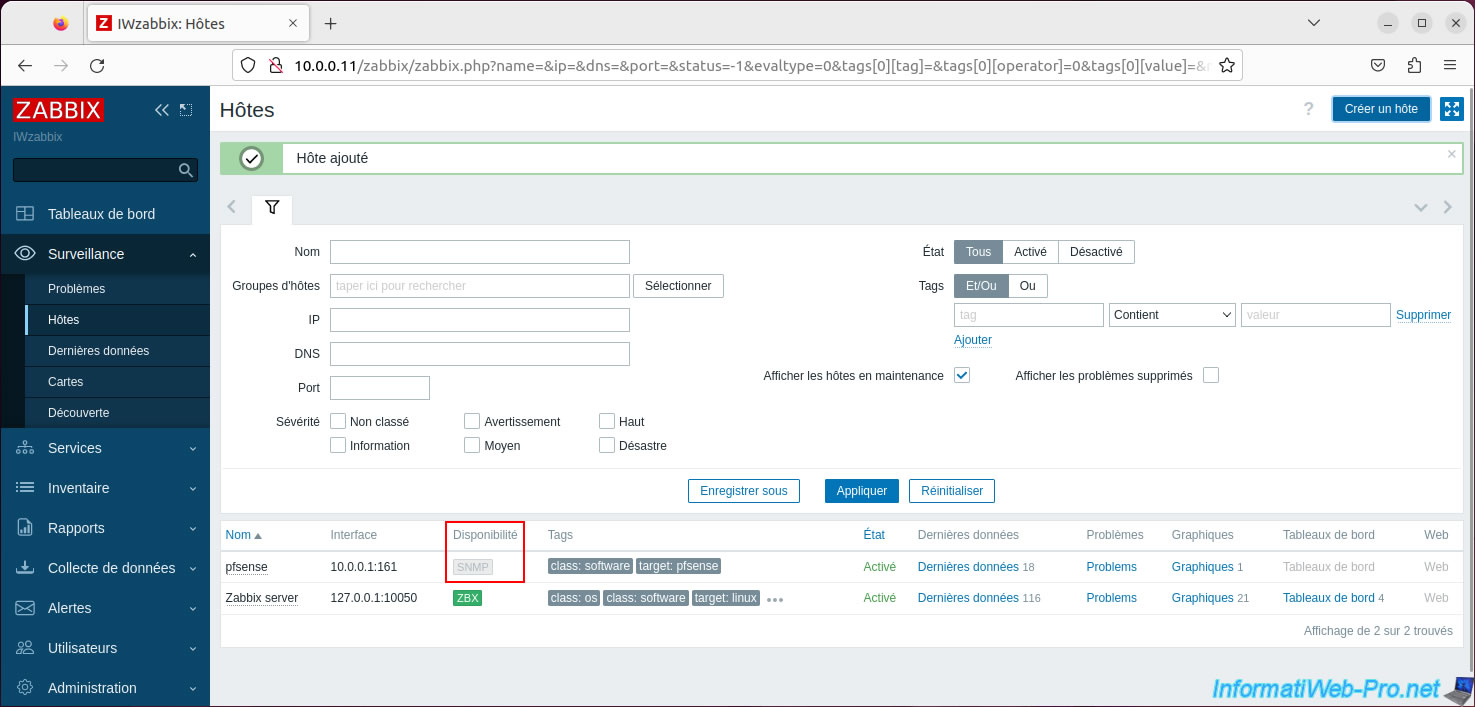
However, a little later (around 30 seconds), the SNMP availability will turn green.
This is simply due to the delay in receiving data via SNMP.
Click the "Latest Data" link for the added "pfsense" host.
On the "Latest Data" page that will appear, you can filter the results.
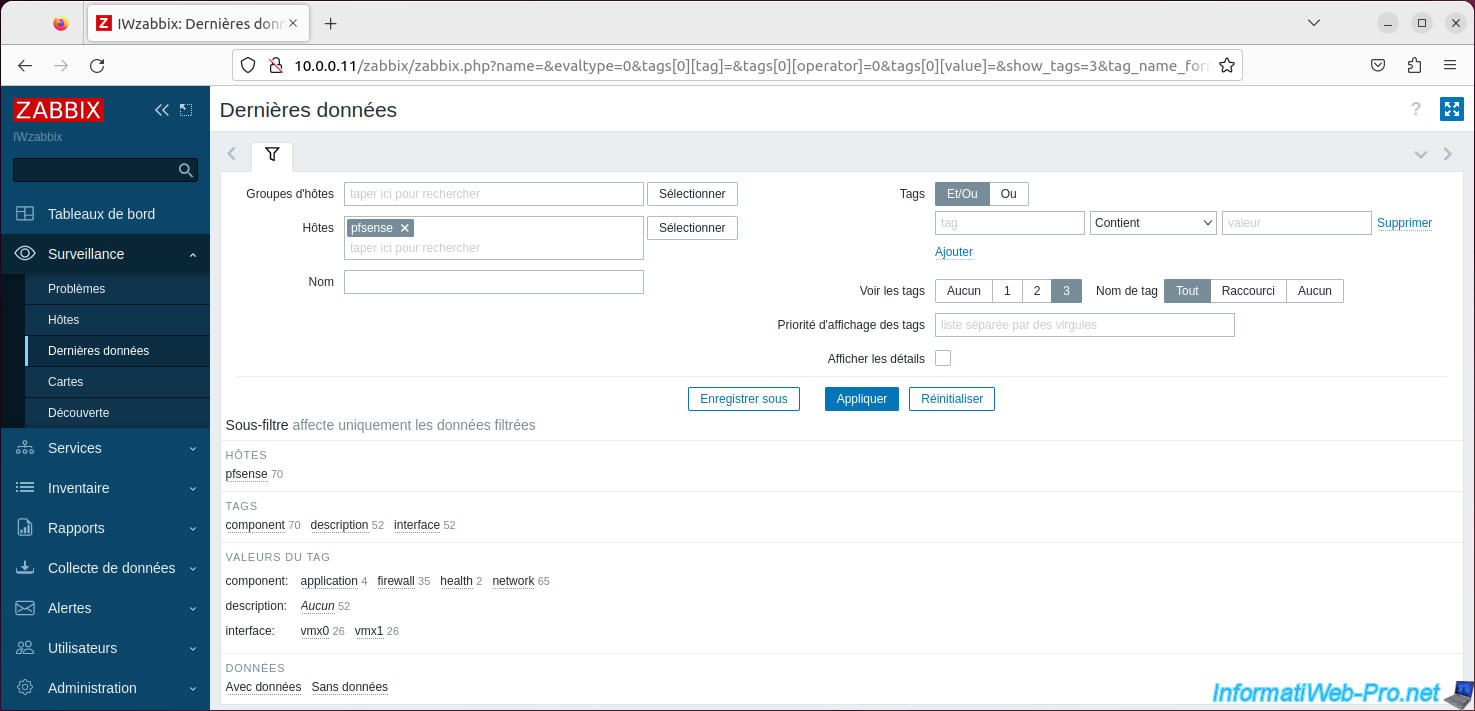
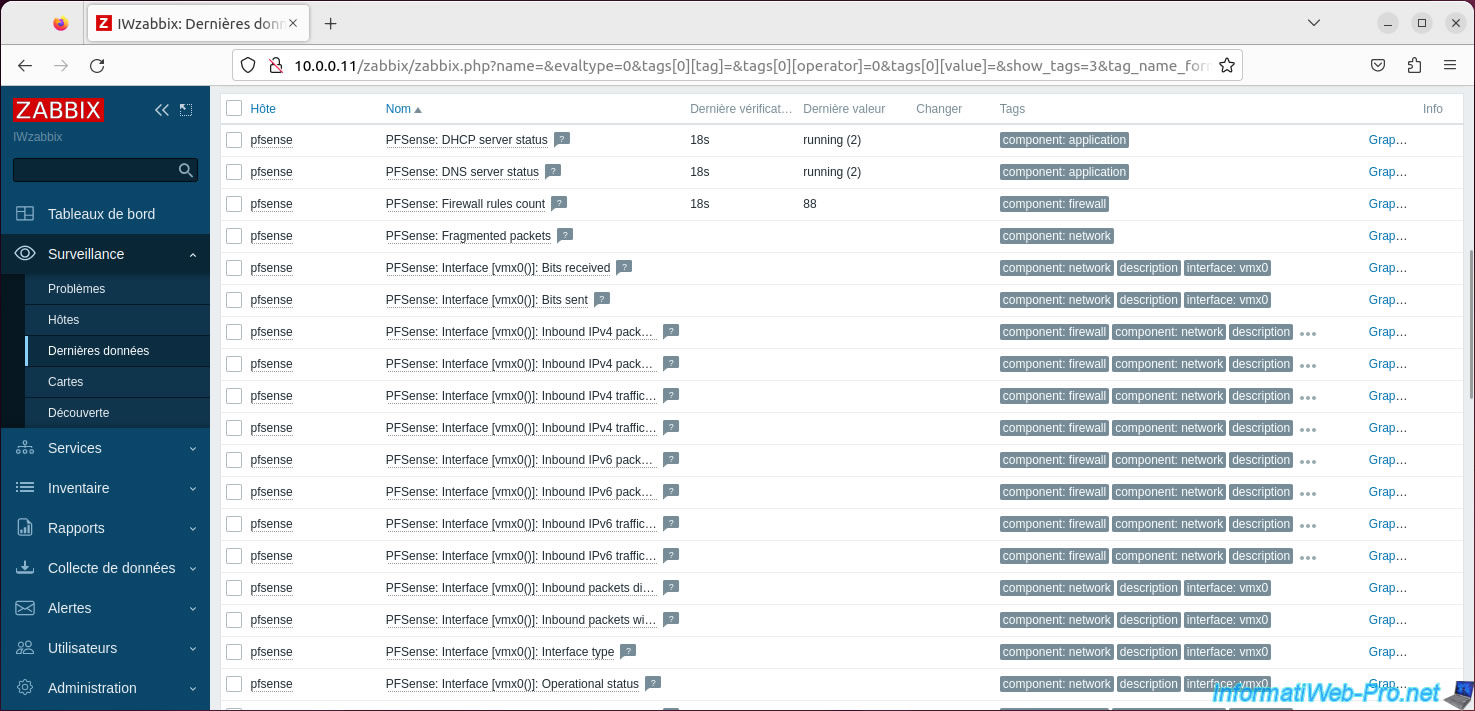
Further down, you will find the list of possible data, as well as their last value.
You can also obtain graphs by clicking on "Graphics".
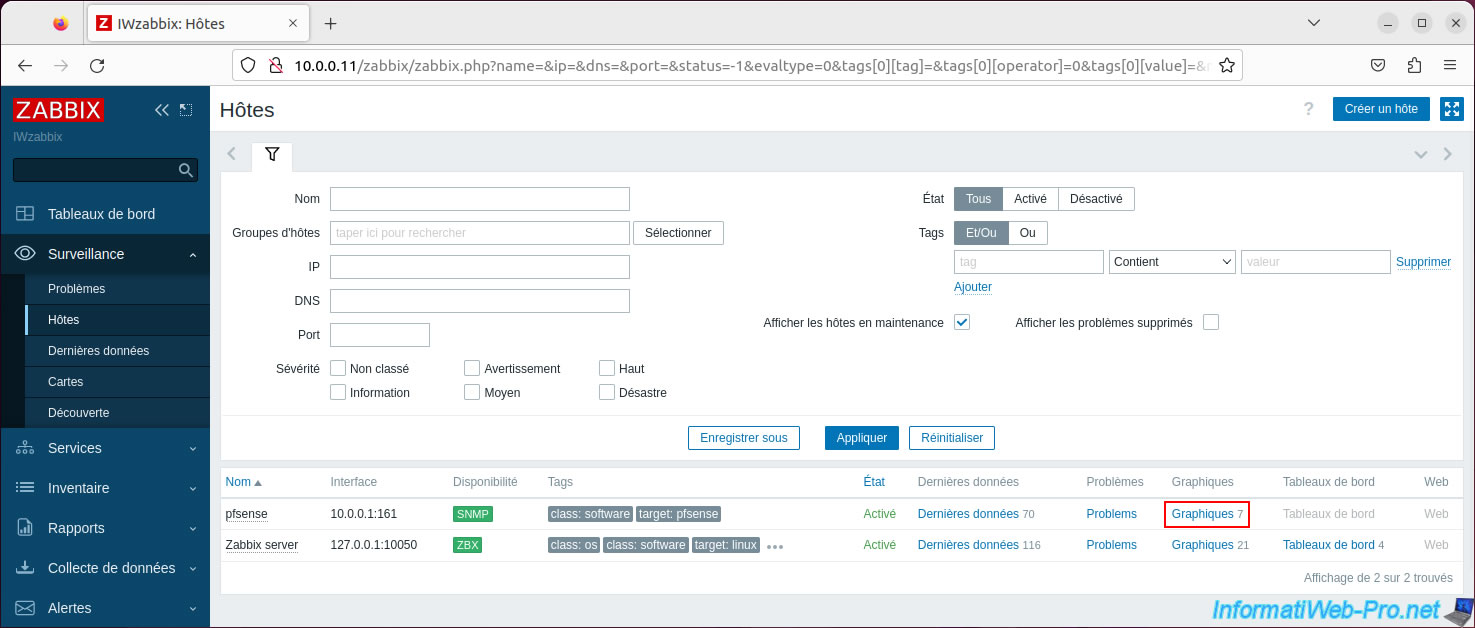
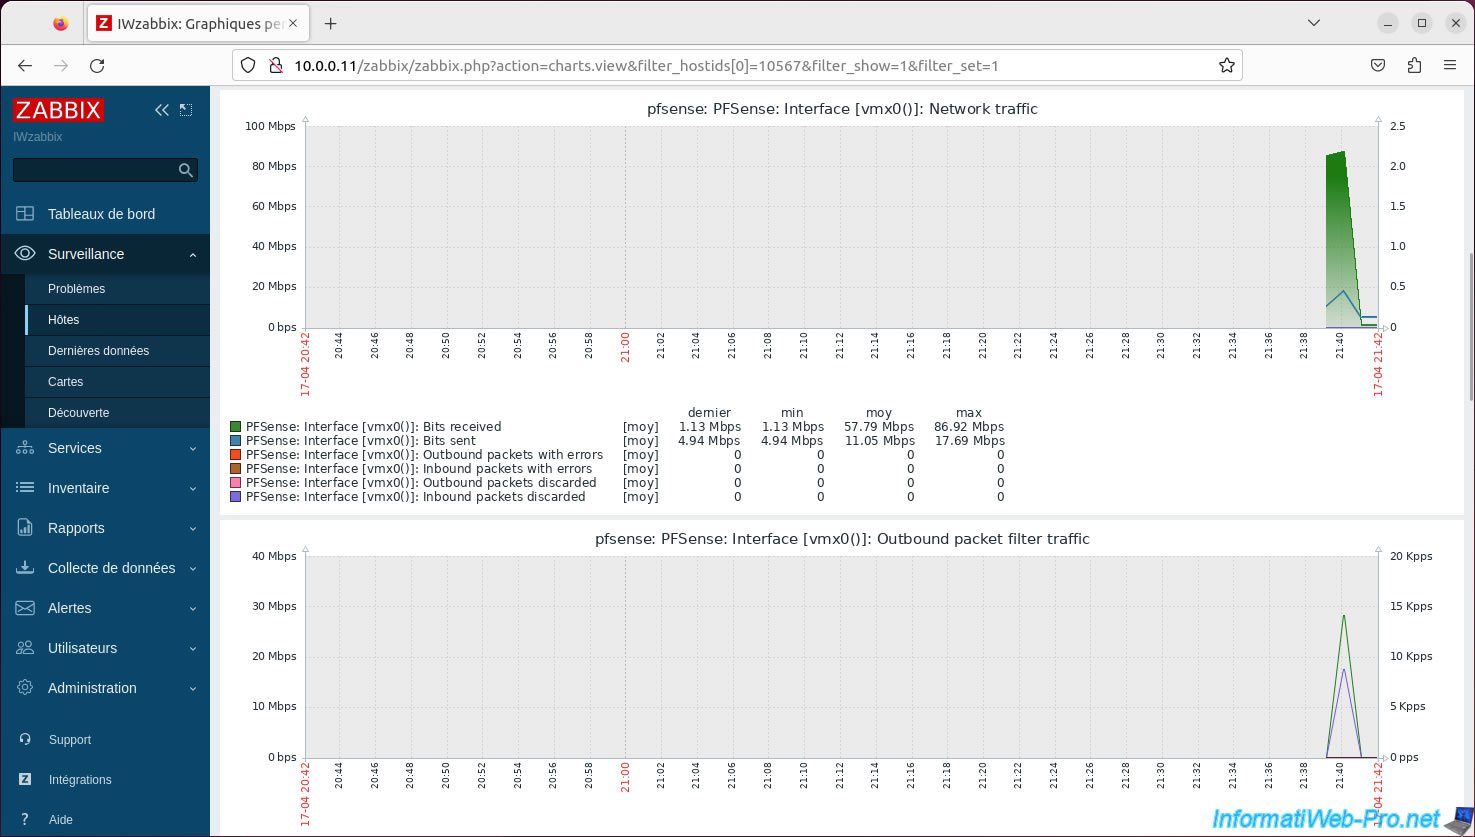
For the graphs, you can select the period for which to generate them.
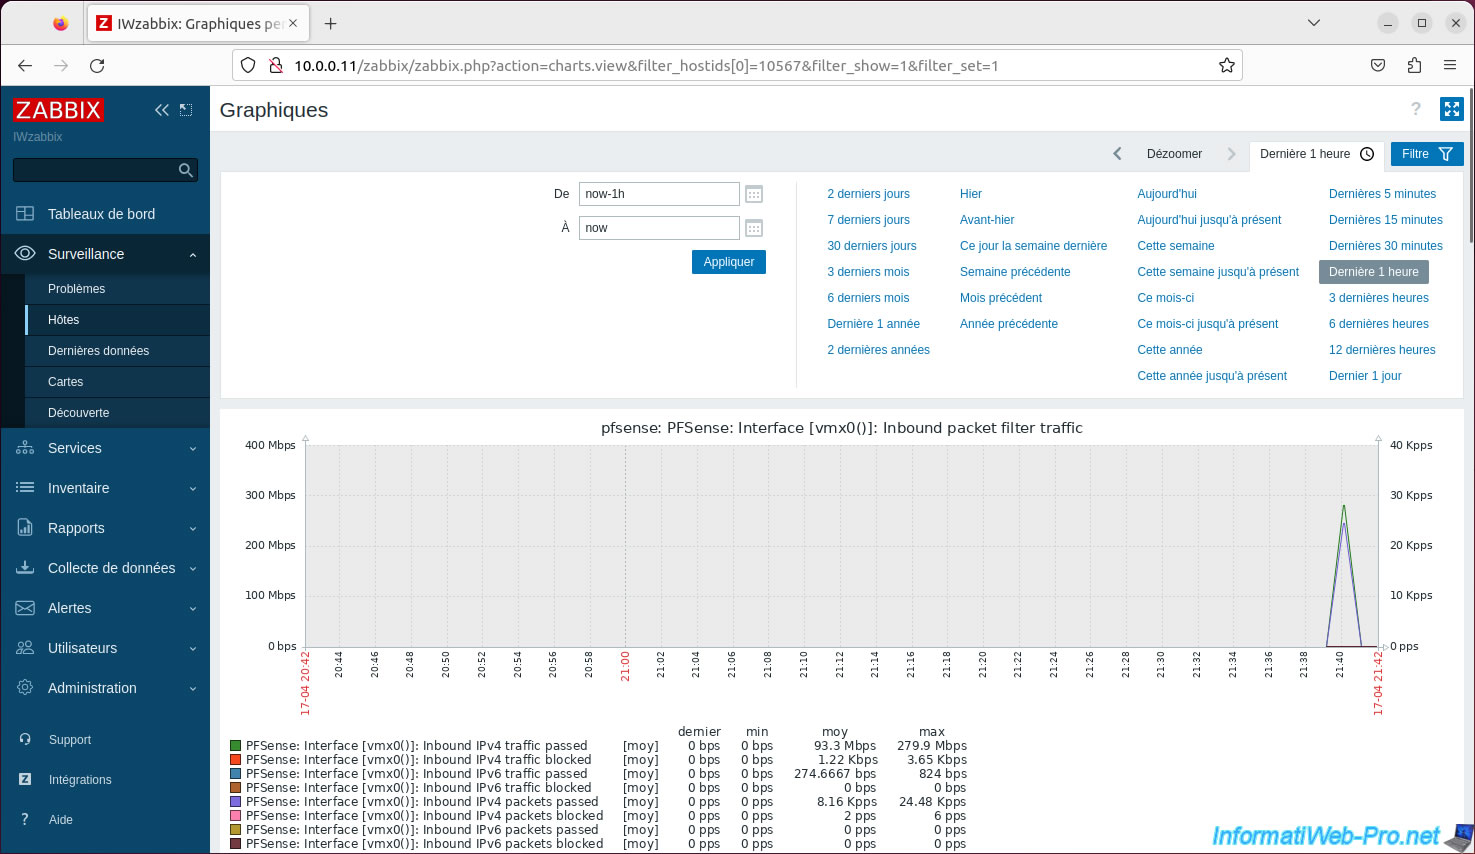
For example, you will find graphs regarding network usage.
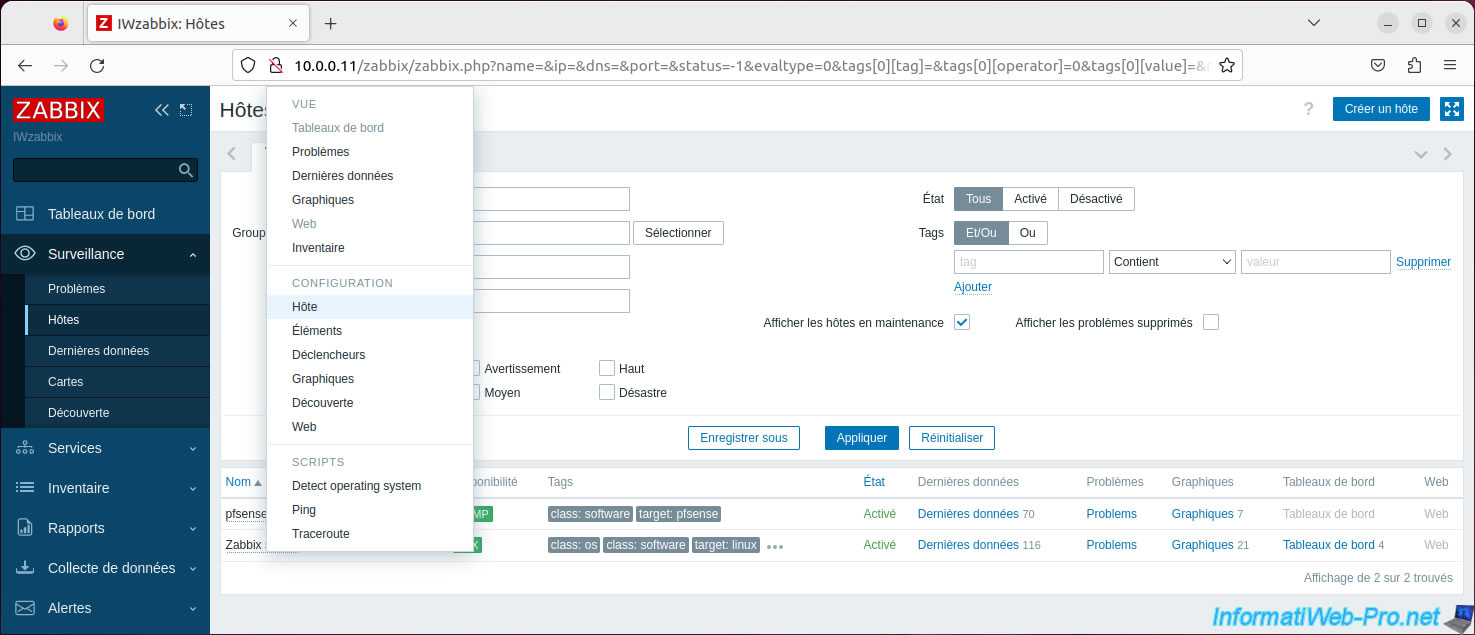
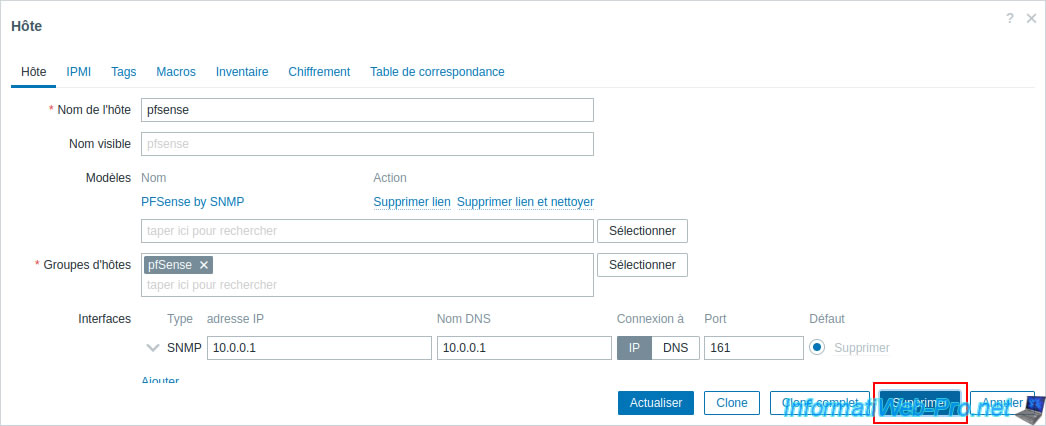
If necessary, to remove a host from Zabbix, simply click on its name, then click: Host.
Then, click: Delete.
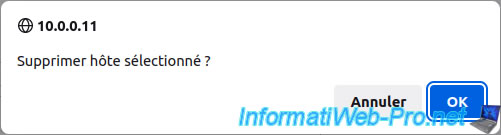
Confirm the deletion by clicking OK.
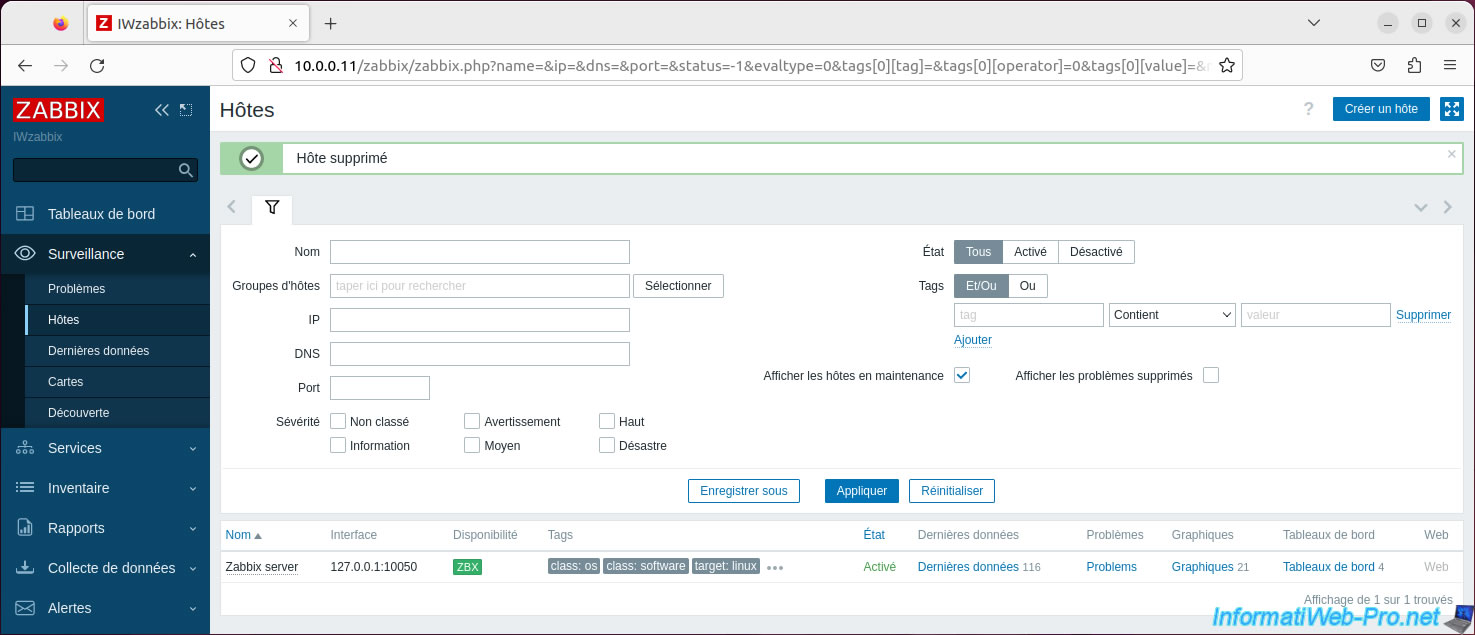
The desired host has been deleted.
Share this tutorial
To see also
-

Firewall 6/11/2025
pfSense 2.6 - Create a DMZ and configure the firewall
-

Firewall 9/3/2025
pfSense 2.6 - Create a site-to-site (S2S) VPN tunnel via IPsec
-
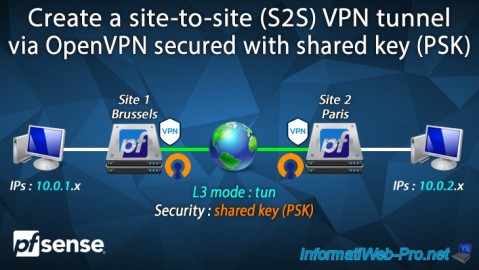
Firewall 9/12/2025
pfSense 2.6 - Create a site-to-site (S2S) VPN tunnel via OpenVPN secured with shared key (PSK)
-
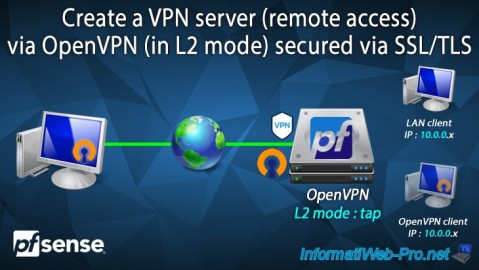
Firewall 9/10/2025
pfSense 2.6 - Create a VPN server (remote access) via OpenVPN (L2 mode)
No comment