Create a site-to-site (S2S) VPN tunnel via IPsec on pfSense 2.6 to connect 2 networks together
- Firewall
- pfSense
- 03 September 2025 at 07:43 UTC
-

- 5/5

3. Connect IPsec tunnel
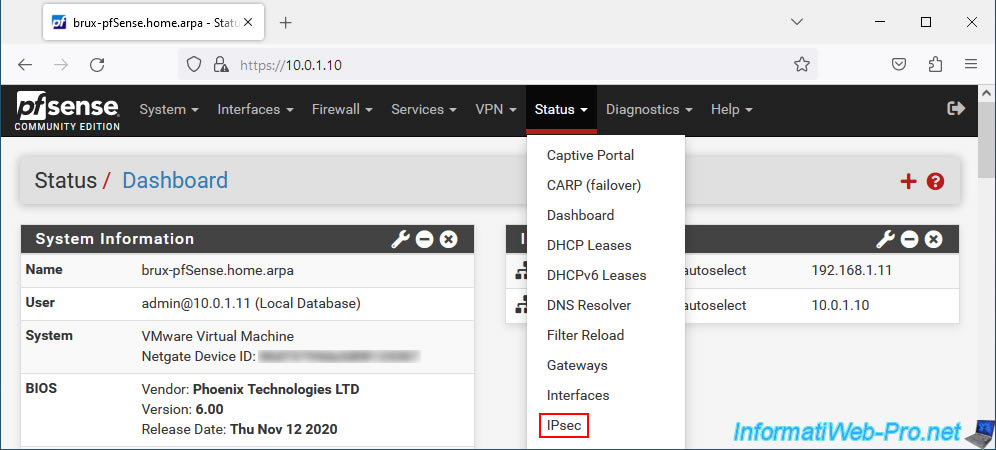
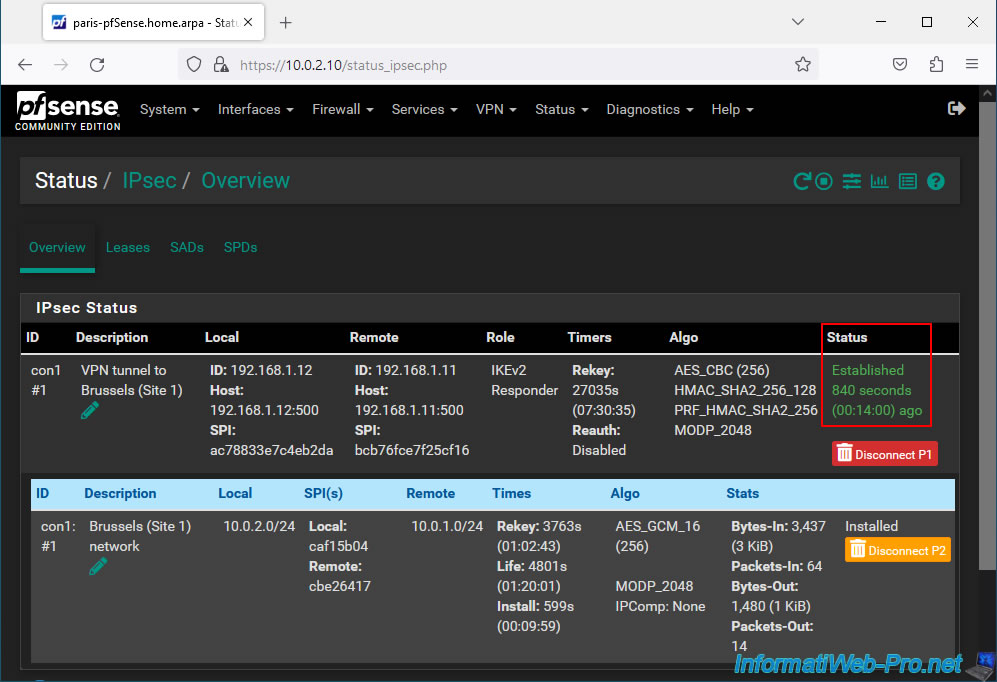
To connect the IPsec tunnel or view its status, go to: Status -> IPsec.
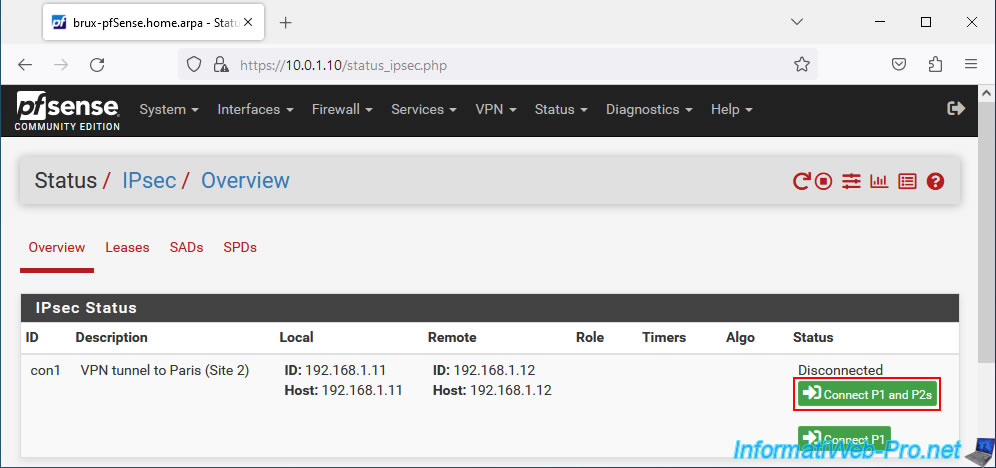
To connect the IPsec tunnels, click: Connect P1 and P2s.
Note: it is possible that these are already established.
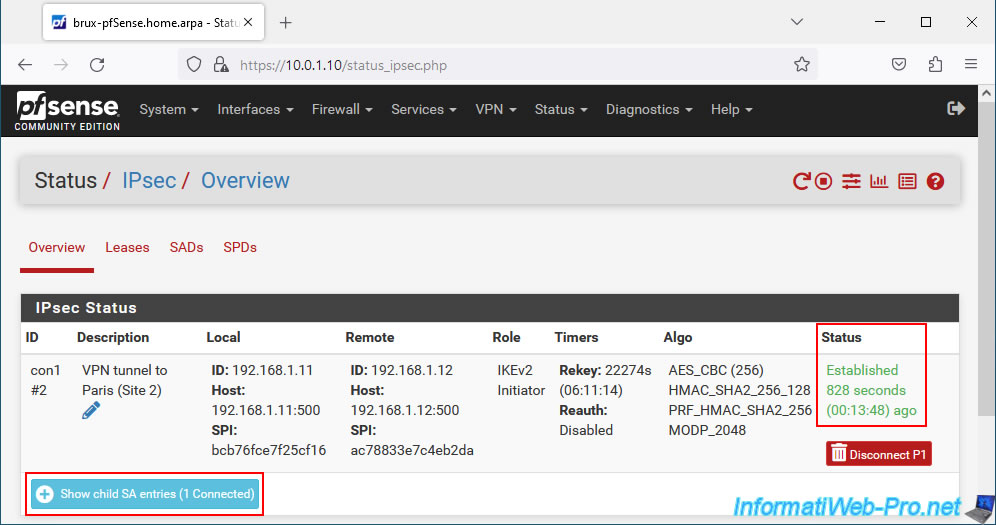
Once the IPsec tunnel is established, you will see that its status is "Established".
To see the child P2 tunnels, click: Show child SA entries.
You will be able to see the number of incoming (-In) and outgoing (-Out) packets and bytes increase.
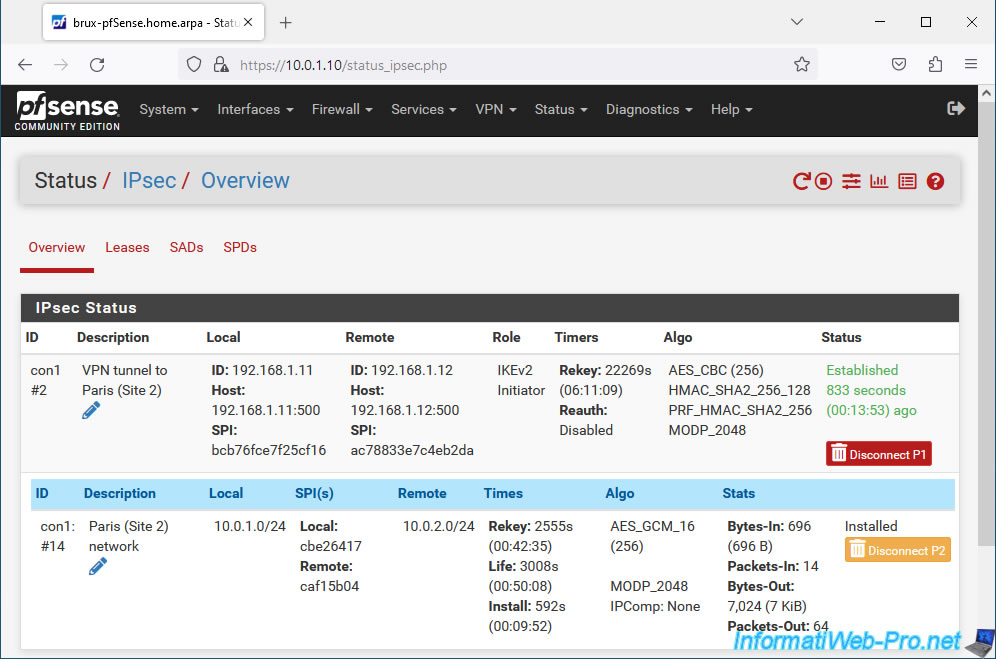
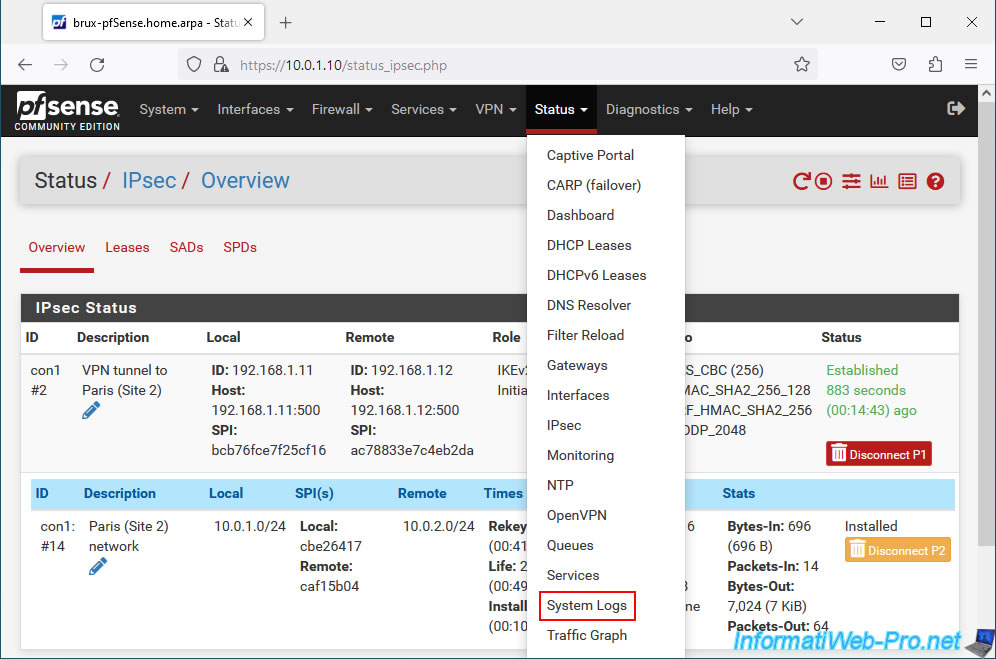
Once the IPsec tunnel is established on one side, it will also appear as "Established" on the other peer.
4. View logs for IPsec
If there is a problem with IPsec, check the pfSense logs.
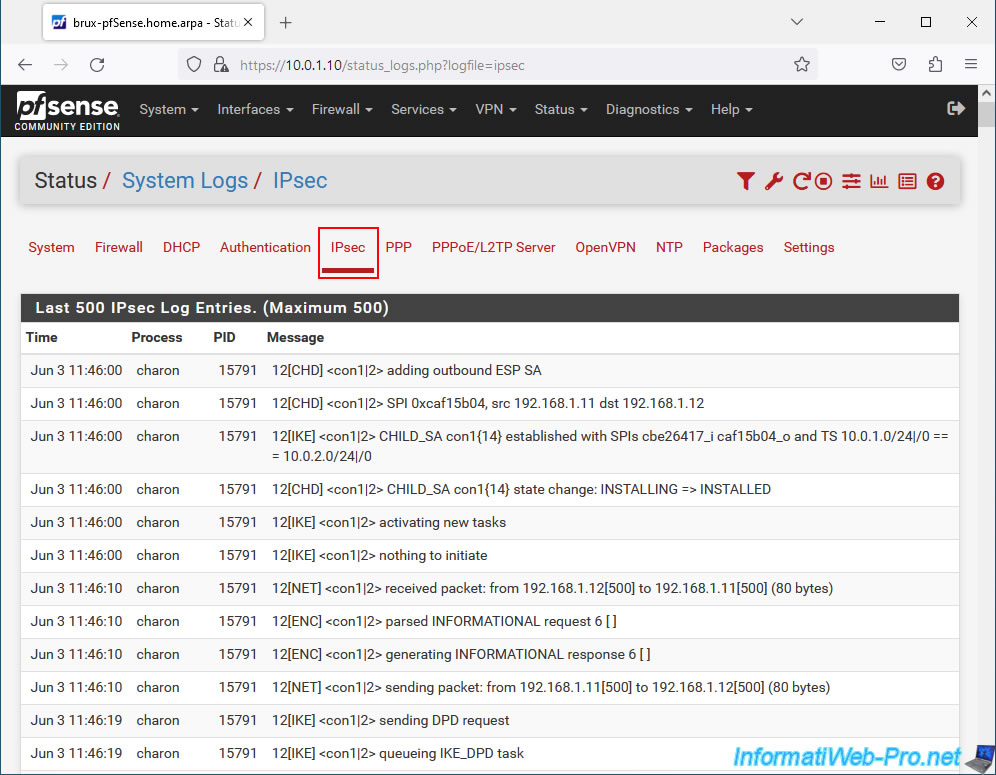
To do this, go to "Status -> System Logs", then go to the "IPsec" tab of the page that will be displayed.
Otherwise, click on the penultimate red icon at the top right to access the same page.
In the "IPsec" tab, you will see a lot of information regarding the IPsec service.
5. Testing ping via IPsec tunnel
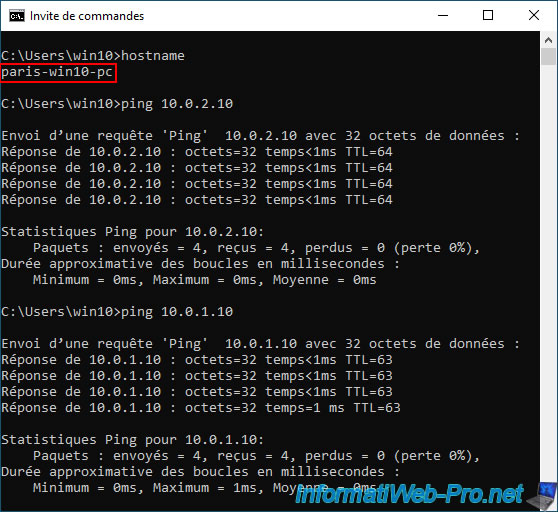
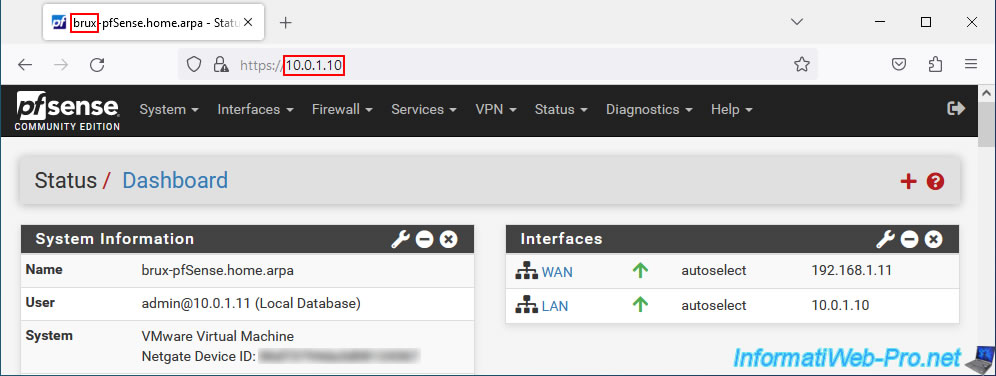
To begin, if your IPsec tunnel is established, try to ping the LAN IP address (therefore internal) of each pfSense machine from a computer or server on site 1 (Brussels).
As you can see, our PC at site 1 (Brussels) can communicate without problems with the pfSense machine in Brussels and the one in Paris using its LAN IP address.
Which proves that the tunnel works.

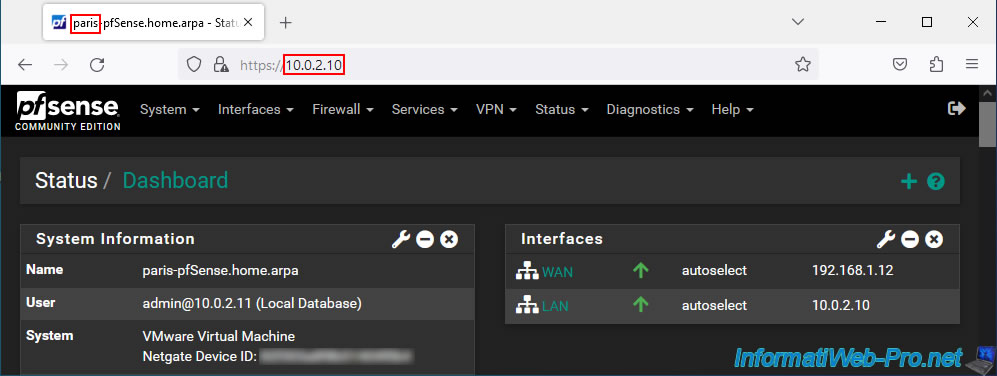
Do the same test from a machine at site 2 (Paris) to be sure that traffic passes correctly in both directions.
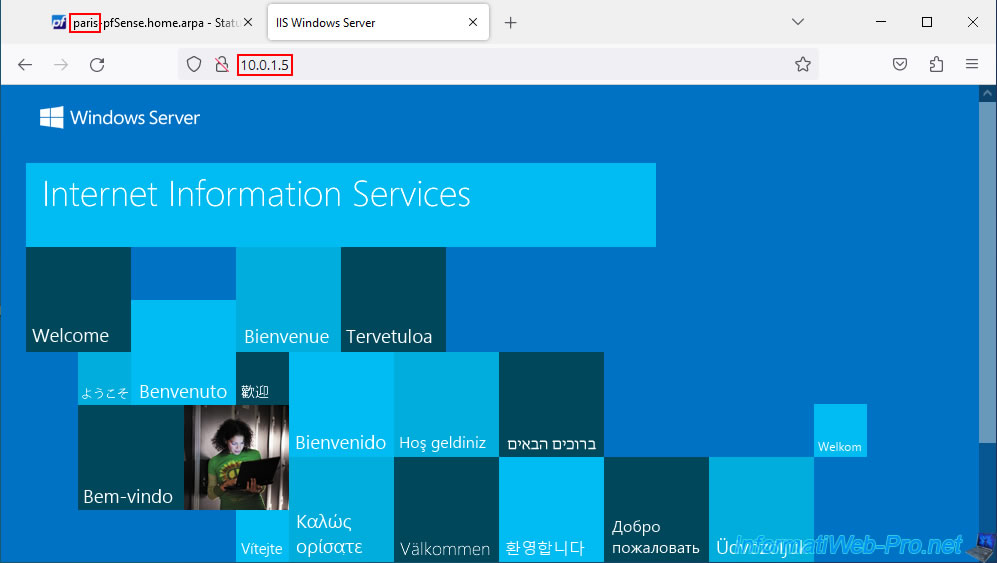
6. Testing access to a website from a remote site
As a test, we installed a web server on each physical site.
As you can see, we are on our PC at site 1 (Brussels) and the LAN IP address of pfSense is "10.0.1.10".
But, we can also access without problem the website hosted on the web server of site 2 (Paris) thanks to its LAN IP address "10.0.2.5".

On site 2 (Paris), the pfSense LAN IP address is "10.0.2.10".
As expected, we can access the website of site 1 (Brussels) without any problem thanks to the site-to-site IPsec tunnel established between the 2 pfSense machines.
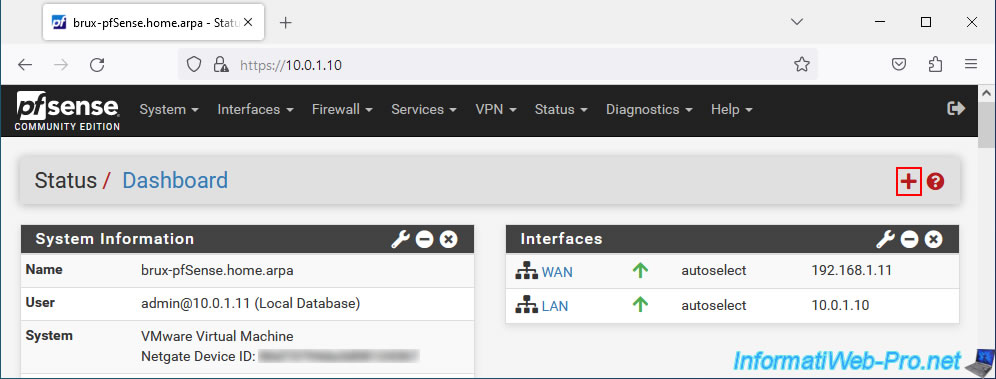
7. Add the IPsec widget to the pfSense dashboard (optional)
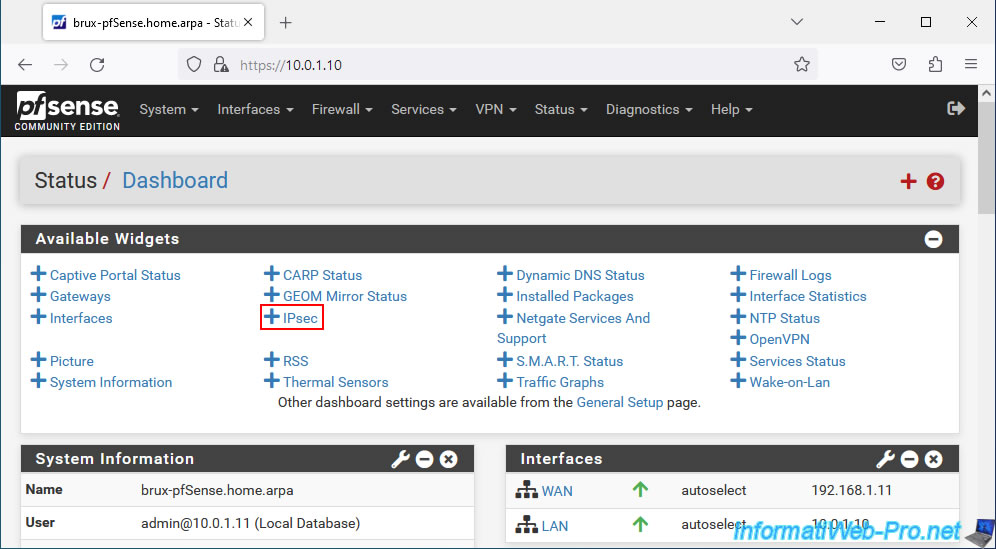
If you wish, you can add the "IPsec" widget to the pfSense dashboard by clicking on the pfSense logo, then on the red "+" icon at the top right.
In the "Available Widgets" section that appears, click on "IPsec".
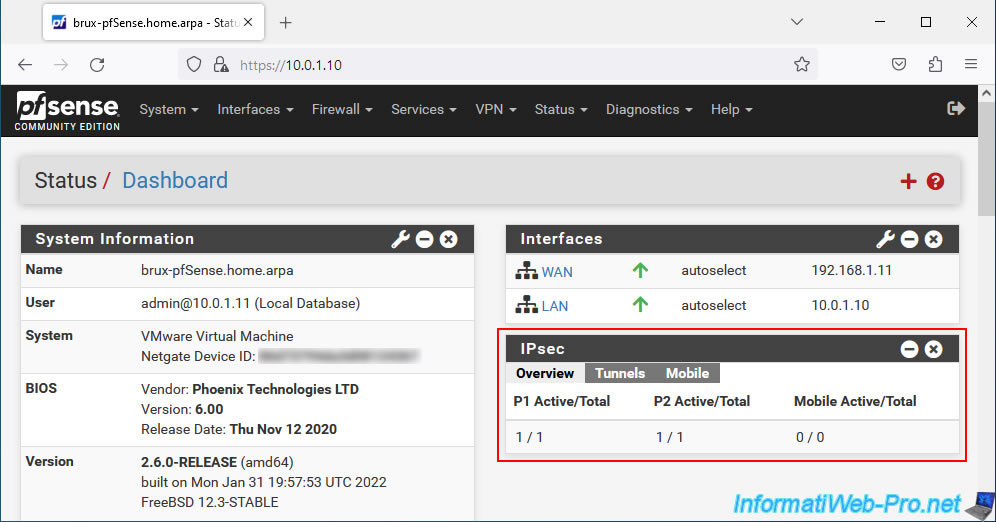
The "IPsec" widget appears.
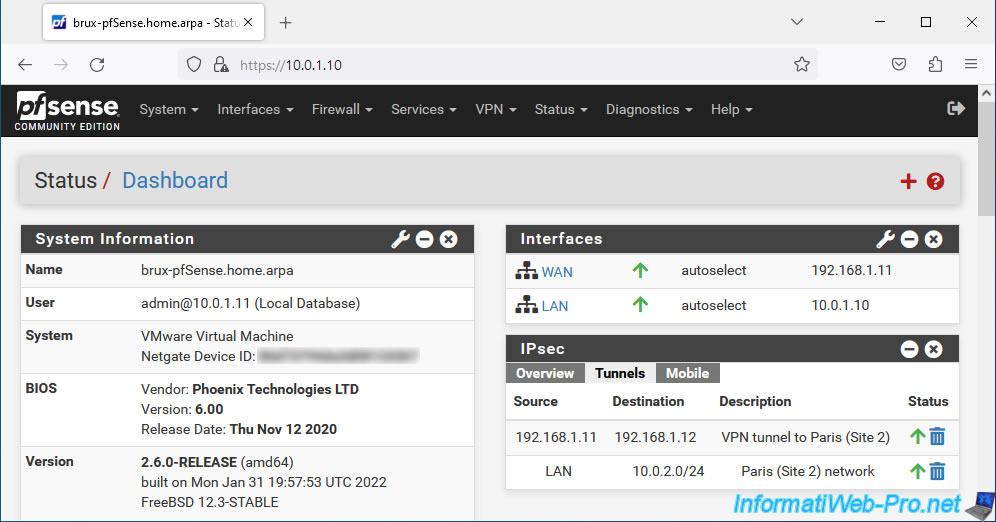
Go to the "Tunnels" tab of this "IPsec" widget to view the configured IPsec tunnels (P1 and P2).
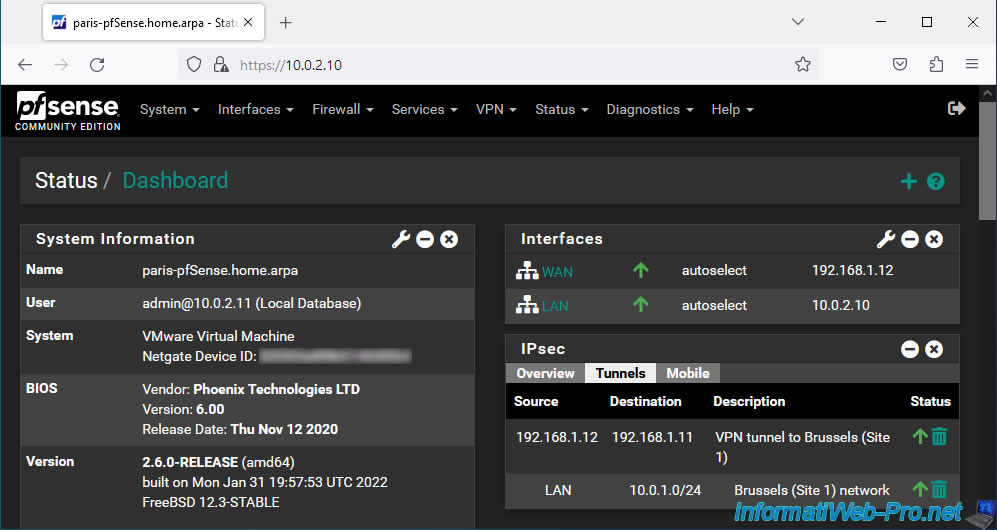
Do the same on the other site.
Share this tutorial
To see also
-
Firewall 6/11/2025
pfSense 2.6 - Create a DMZ and configure the firewall
-

Firewall 5/28/2025
pfSense 2.6 - Create and use VLANs
-
Firewall 6/4/2025
pfSense 2.6 - DNS resolution
-
Firewall 5/17/2025
pfSense 2.6 - Enable SSH protocol
No comment