Monitor vCenter Server (VCSA) and ESXi hosts on a vDS switch using SNMP on VMware vSphere 6.7
- VMware
- 31 January 2025 at 12:25 UTC
-

- 3/3

6. Information about your servers and virtual machines
As you can see, with ManageEngine OpManager you will be able to easily monitor the availability of your servers, as well as network traffic and obtain information regarding your VMware virtual infrastructure.
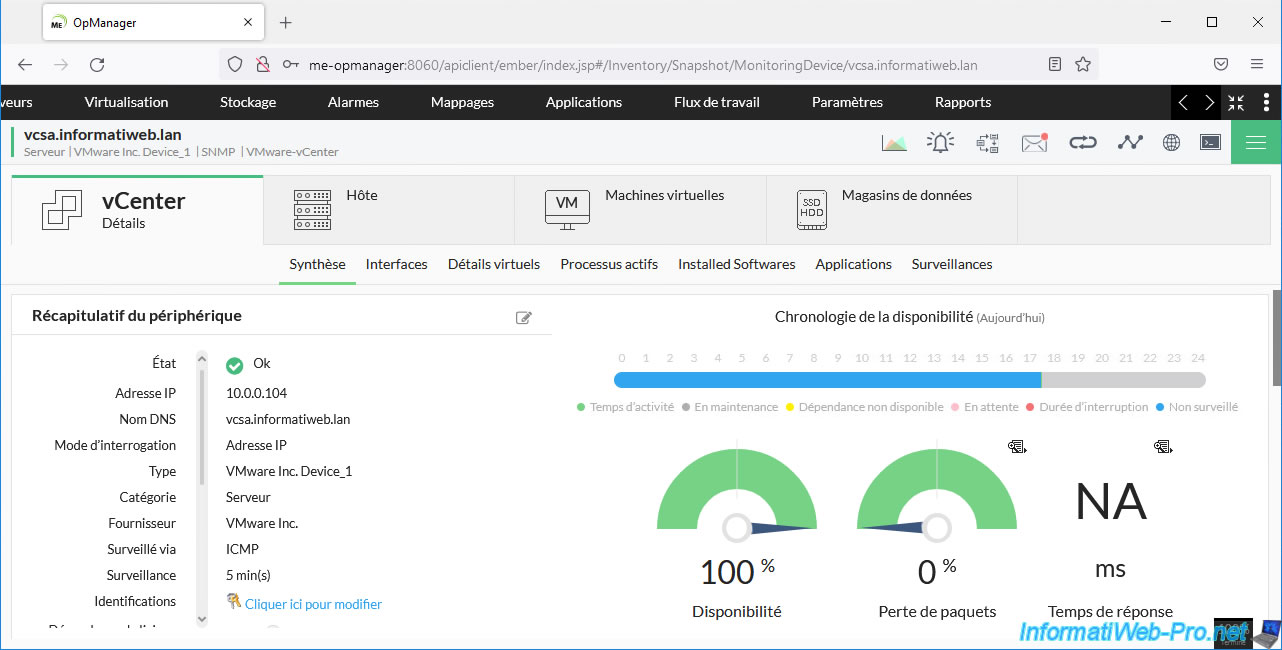
In the vCenter Server summary, you will be able to see:
- its status
- its IP address
- its DNS domain name
- its availability index
- and more
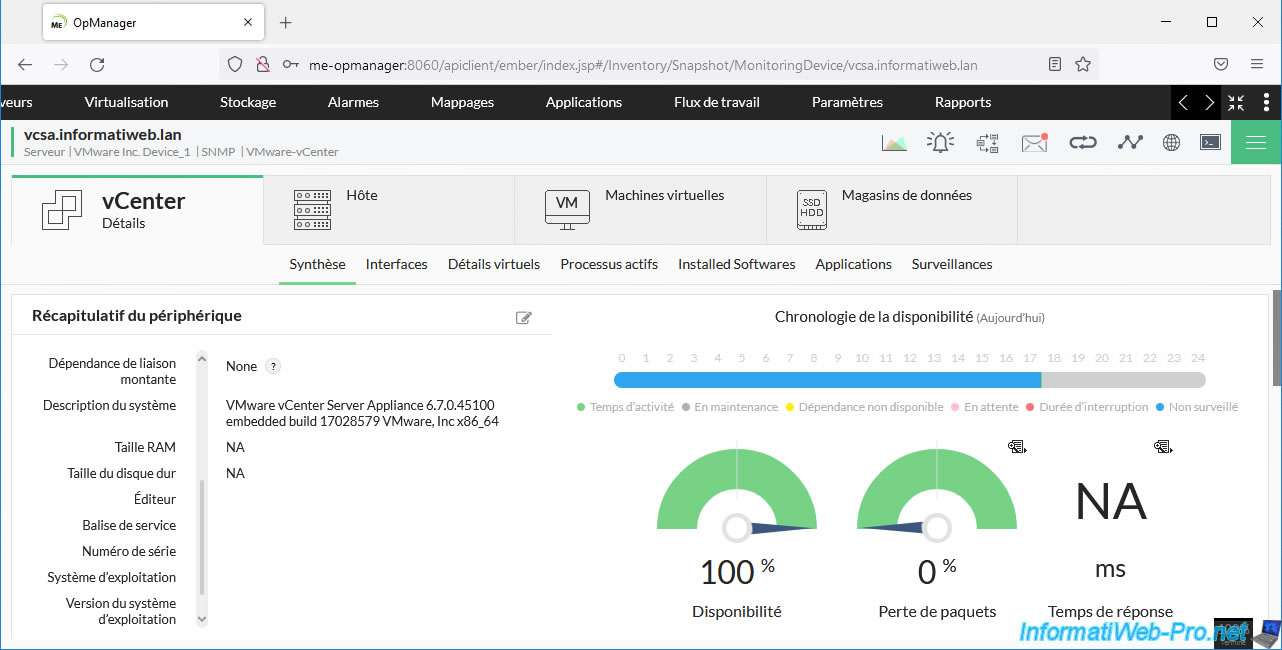
A little further down, you will be able to see your VCSA server version, as well as other information (if applicable).
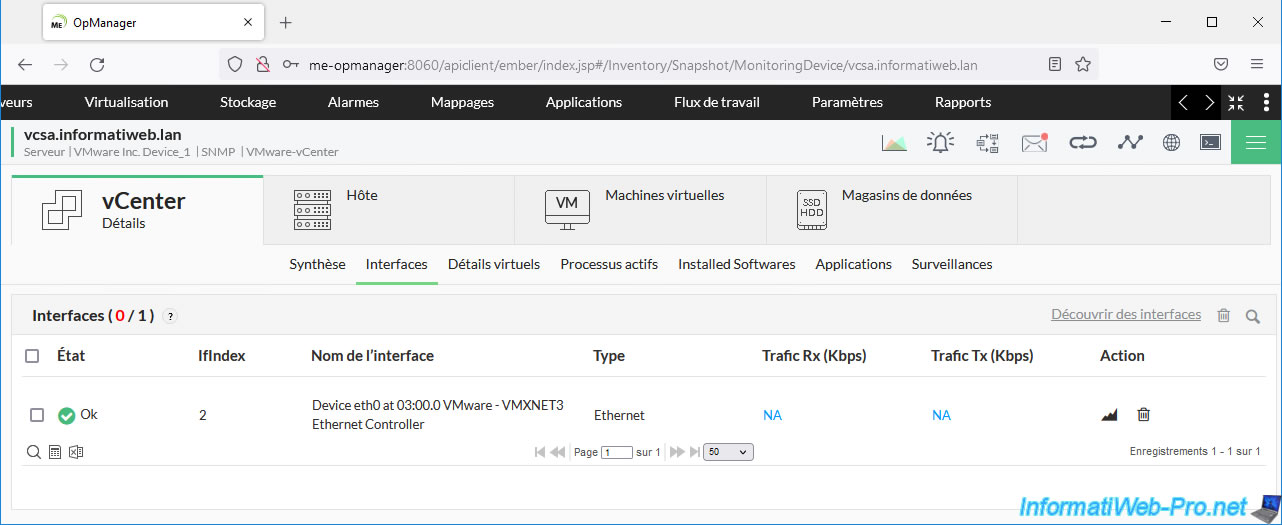
In the "vCenter -> Interfaces" section, you will be able to see the network card of your VCSA server which by default is a VMXNET3 paravirtual network card.
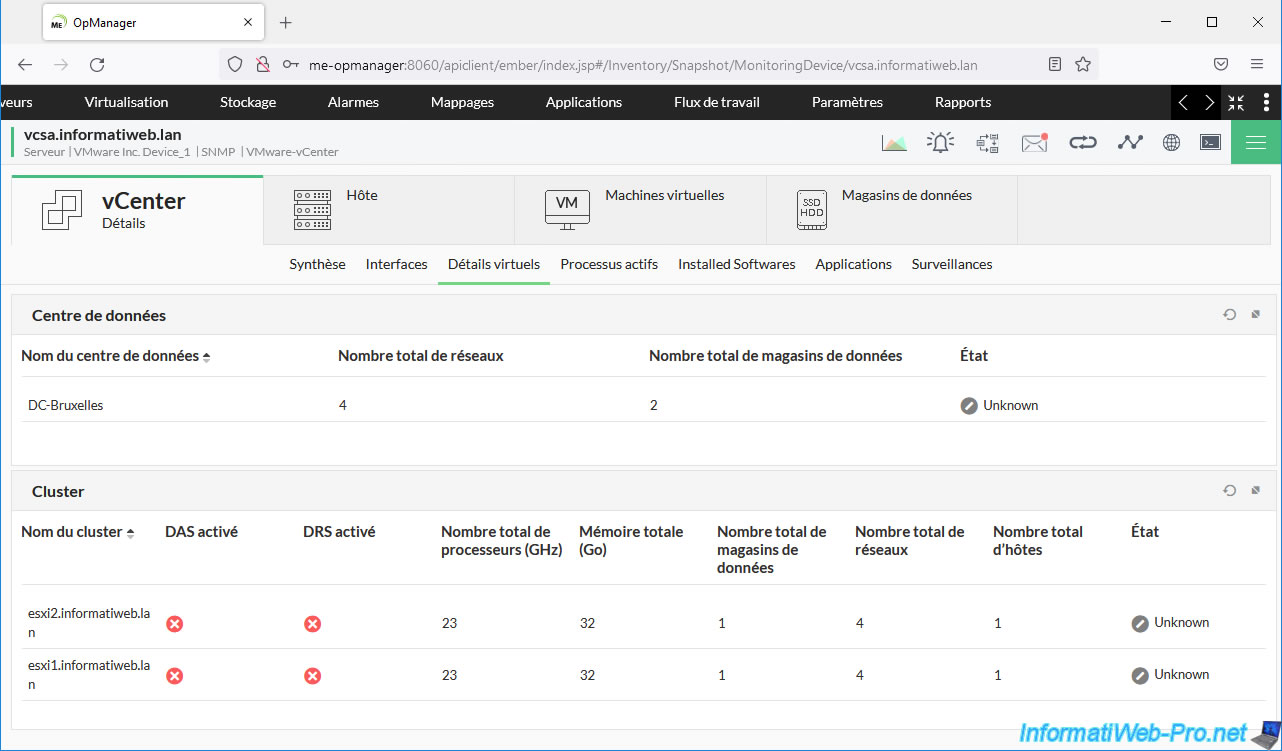
In the "vCenter -> Virtual Details" section, you will be able to see:
- the data centers (DCs) created in your vCenter Server inventory, as well as the number of networks and datastores there.
- information about your VMware clusters (if applicable) with DAS and DRS status, number of processors (in GHz), RAM, number of databanks and network number available on each VMware host ESXi.
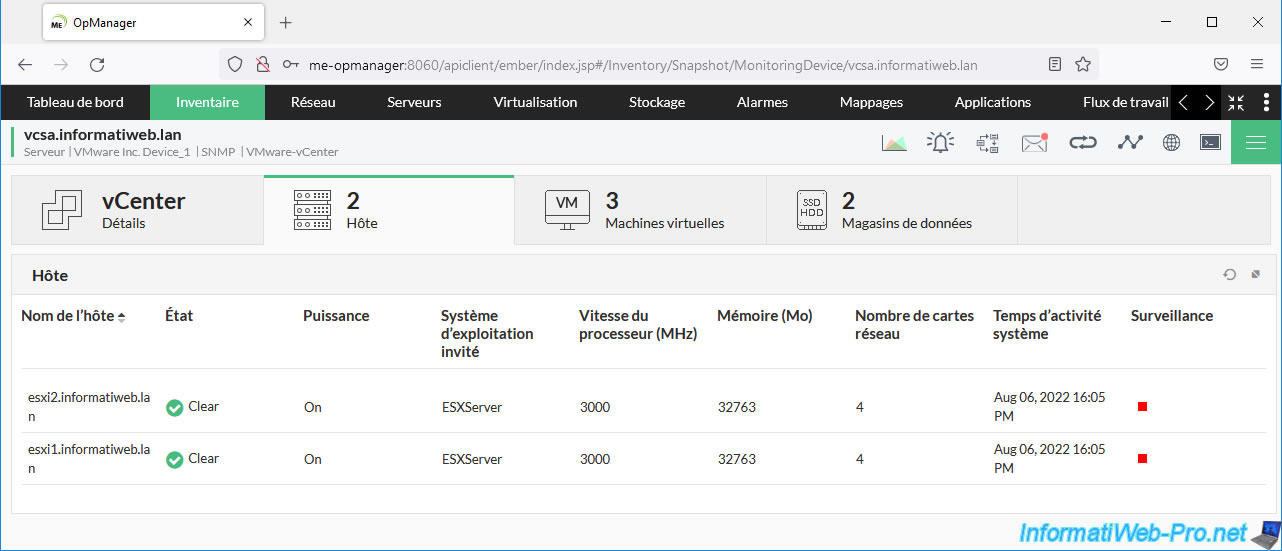
In the "Host" section, you will see the list of VMware ESXi hosts linked to your vCenter Server with information about them:
- the name of the VMware ESXi host.
- the state of this host.
- its power state: On (on) or Off (off).
- its guest operating system (ESXServer).
- the speed of its processor (CPU) in MHz.
- its amount of random access memory (RAM).
- its number of physical network cards.
- its system activity time.
- its surveillance status. By default, all hosts linked to your vCenter Server are monitored by OpManager.
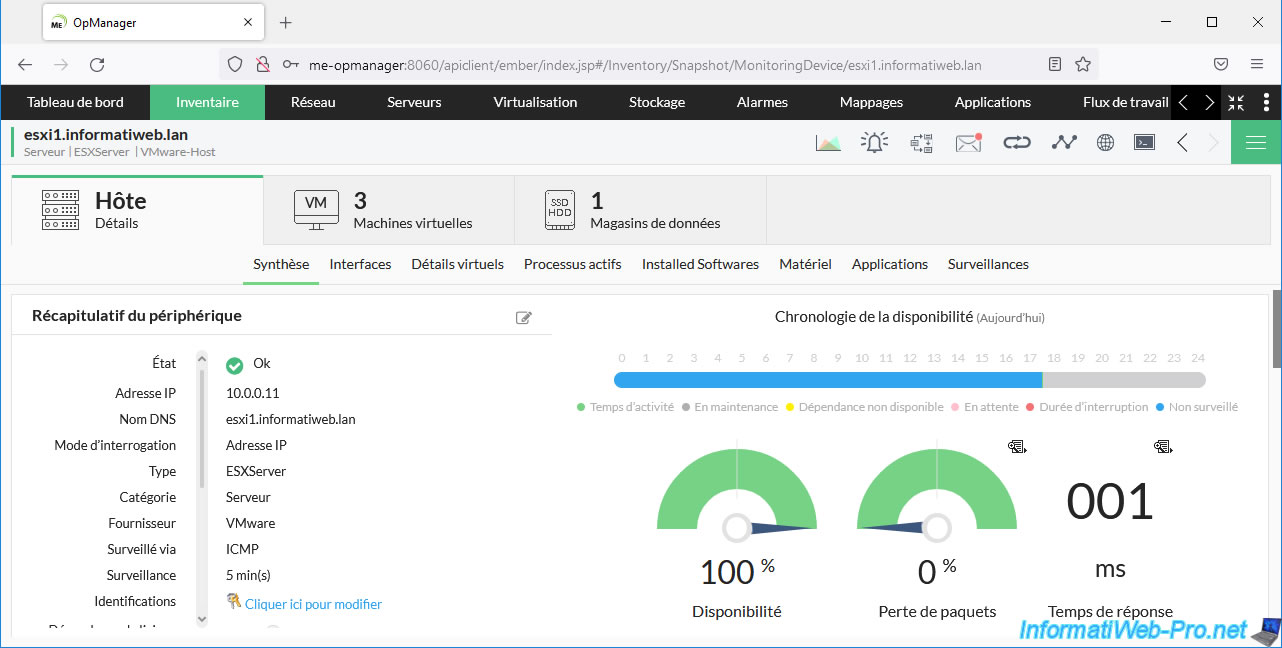
Click the name of one of your VMware ESXi hosts to get detailed information about it.
As for your vCenter Server, you will be able to know its availability rate, its IP address, its DNS domain name, ...
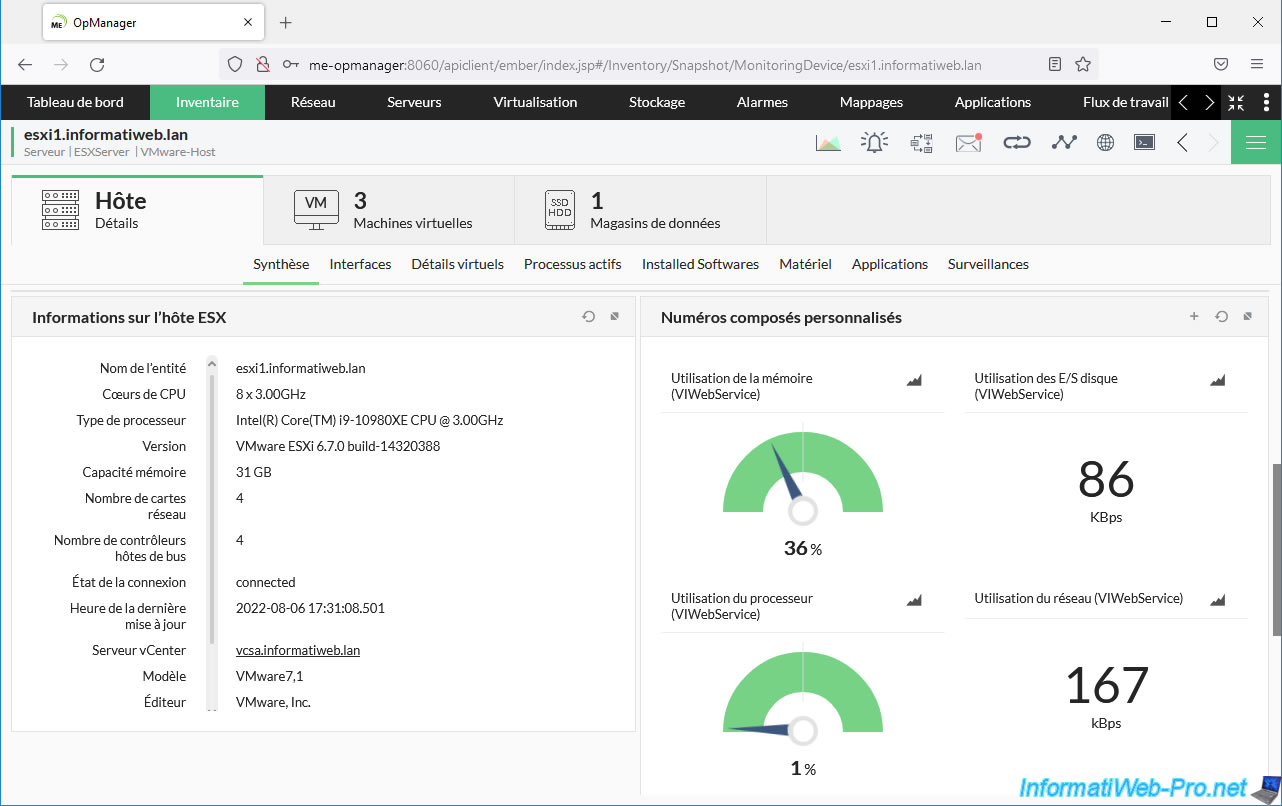
Below, you can obtain information regarding the hardware of your VMware ESXi host:
- Name of the entity: its domain name.
In our case: esxi1.informatiweb.lan. - CPU cores: the number of processor cores and its frequency.
Note that in our case there are only 8 cores available, as this is a virtualized VMware ESXi host. - Processor type: the brand, model, and base frequency of the processor in your VMware ESXi host.
In our case: Intel(R) Core(TM) i9-10980XE CPU @ 3.00 GHz. - Version: the precise version of VMware ESXi that is installed on this server.
- Memory capacity: its amount of random access memory (RAM).
- Number of network cards: the number of physical network cards.
- Number of Bus Host Controllers: number of storage controllers.
- Connection Status: indicates whether the host is connected or not.
- Last Updated Time: time when information about this host was last updated.
- vCenter Server: the domain name of the vCenter Server to which this VMware ESXi host is linked.
- Model: the model of your server. In our case "VMware7.1", because it is a virtualized VMware ESXi host.
- Publisher: the server manufacturer.
On the right, you will be able to see the usage rate of system resources: RAM, CPU, disk I/O and network usage.
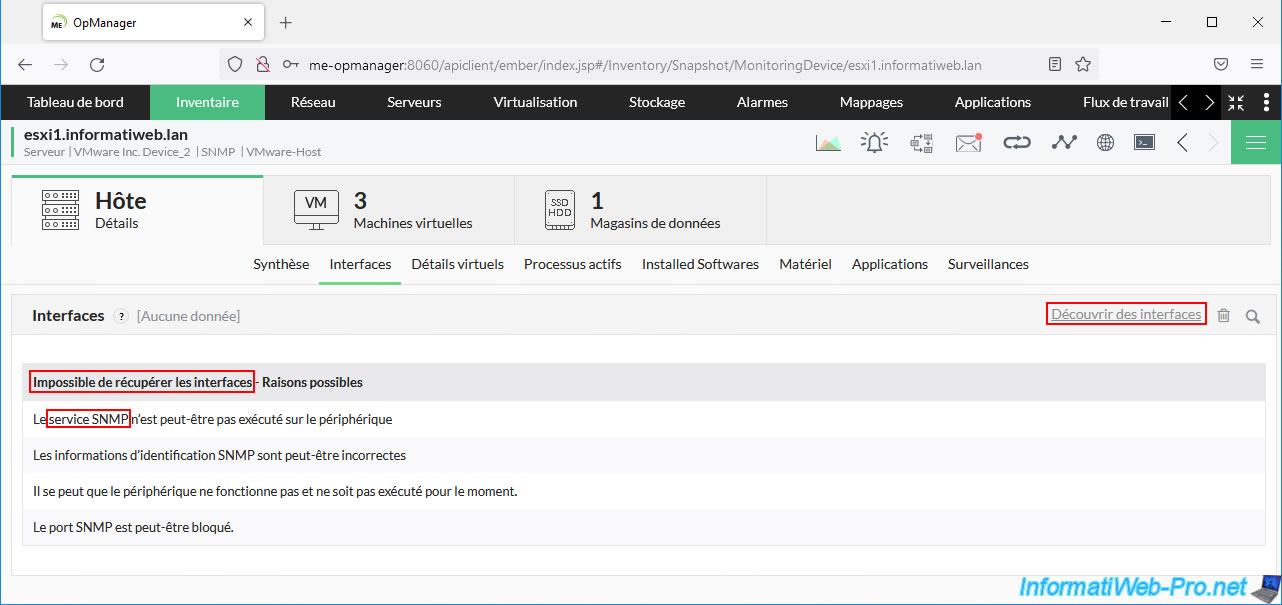
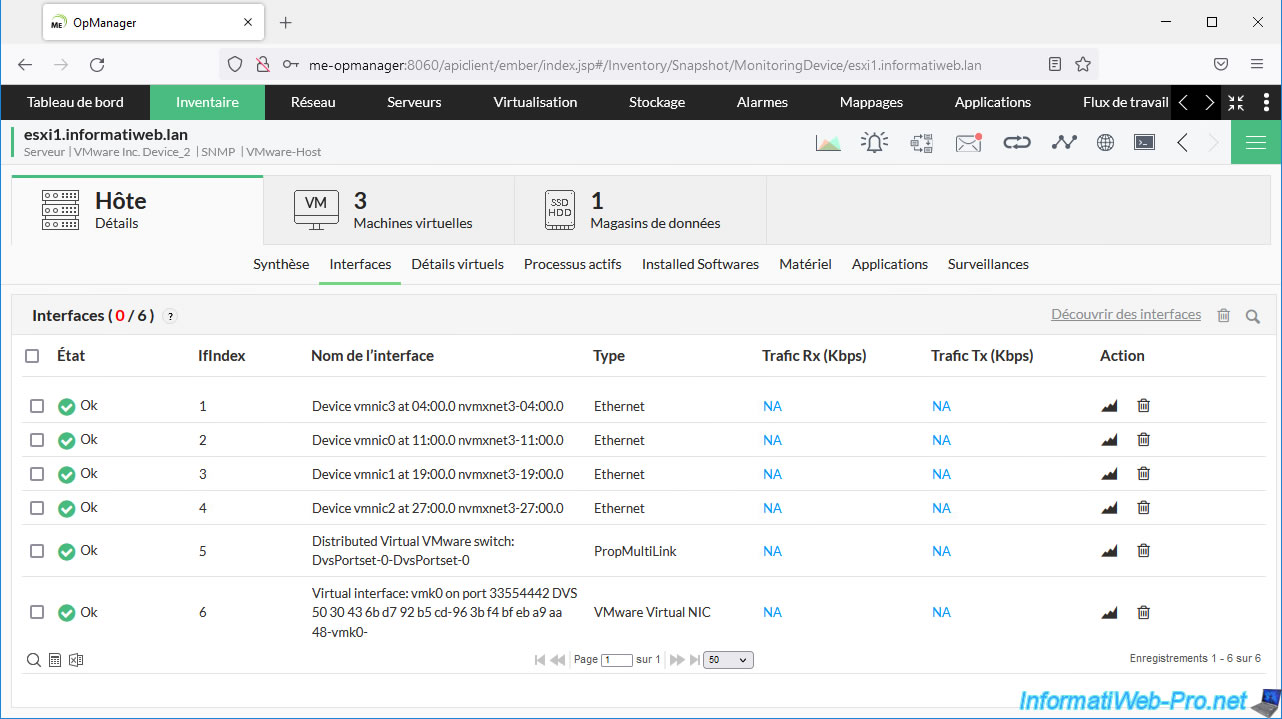
In the "Interfaces" tab of your VMware ESXi host, no data may be displayed.
In this case, ManageEngine OpManager will tell you about the SNMP service.
If you have correctly configured the SNMP service of this host, as well as the SNMP profile on OpManager, simply click on the "Discover Interfaces" link located on the right.
If the SNMP information configured previously is correct, the list of interfaces of your VMware ESXi host will appear.
As you can see, ManageEngine OpManager detected:
- its physical network cards (vmnic0, vmnic1, vmnic2 and vmnic3).
- the distributed virtual switch (Distributed Virtual VMware switch) to which it is connected
- its VMkernel interface (vmk0)
Click Save.

The list of interfaces of your VMware ESXi host appears.
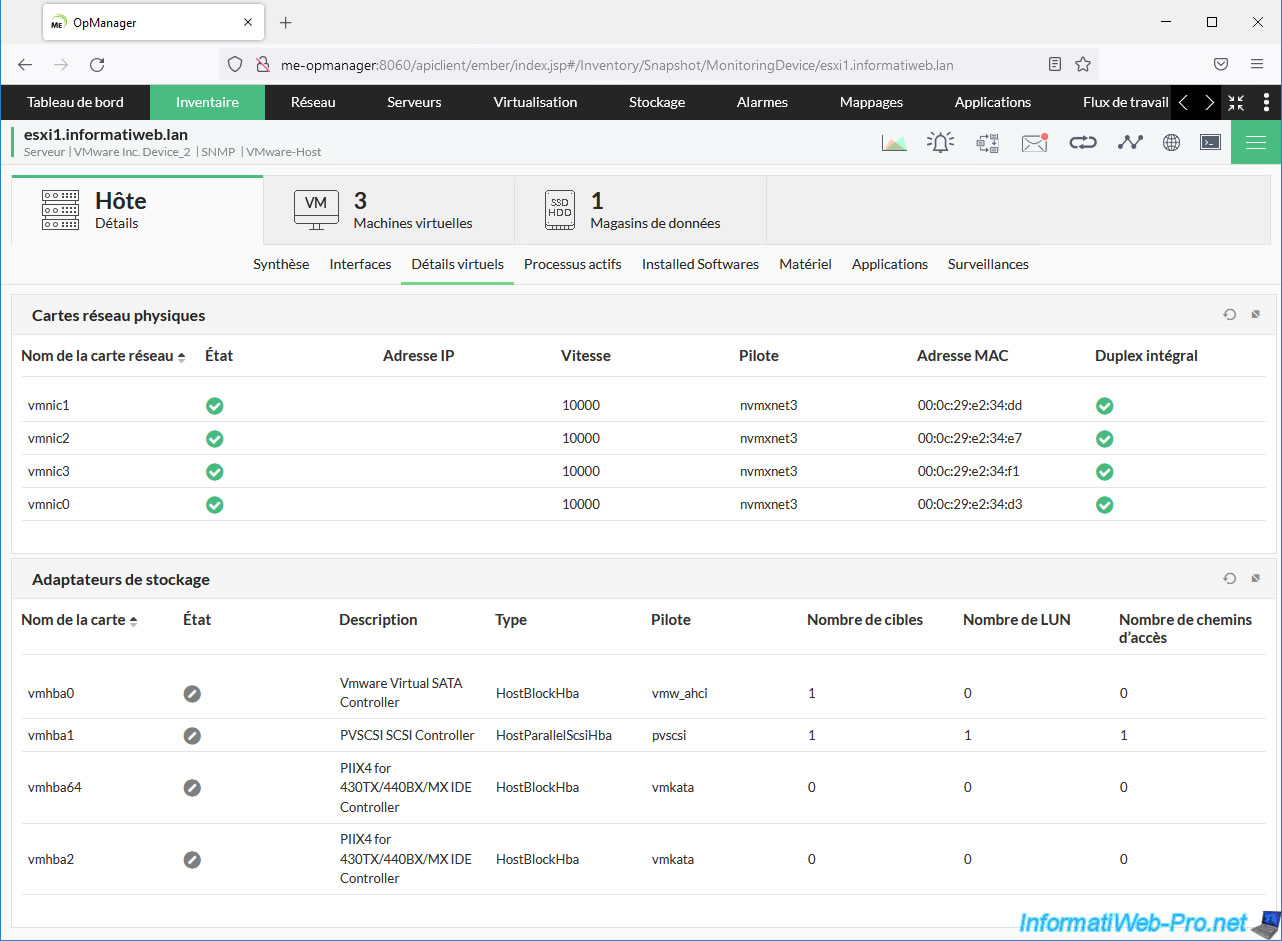
In the "Host -> Virtual Details" section you will see:
- the list of physical network cards of this host, with their status, their speed (in Mbps), the name of the driver used, their MAC address and the availability of Full Duplex or not.
- the list of storage adapters (storage controllers) with their name, the driver used, ...
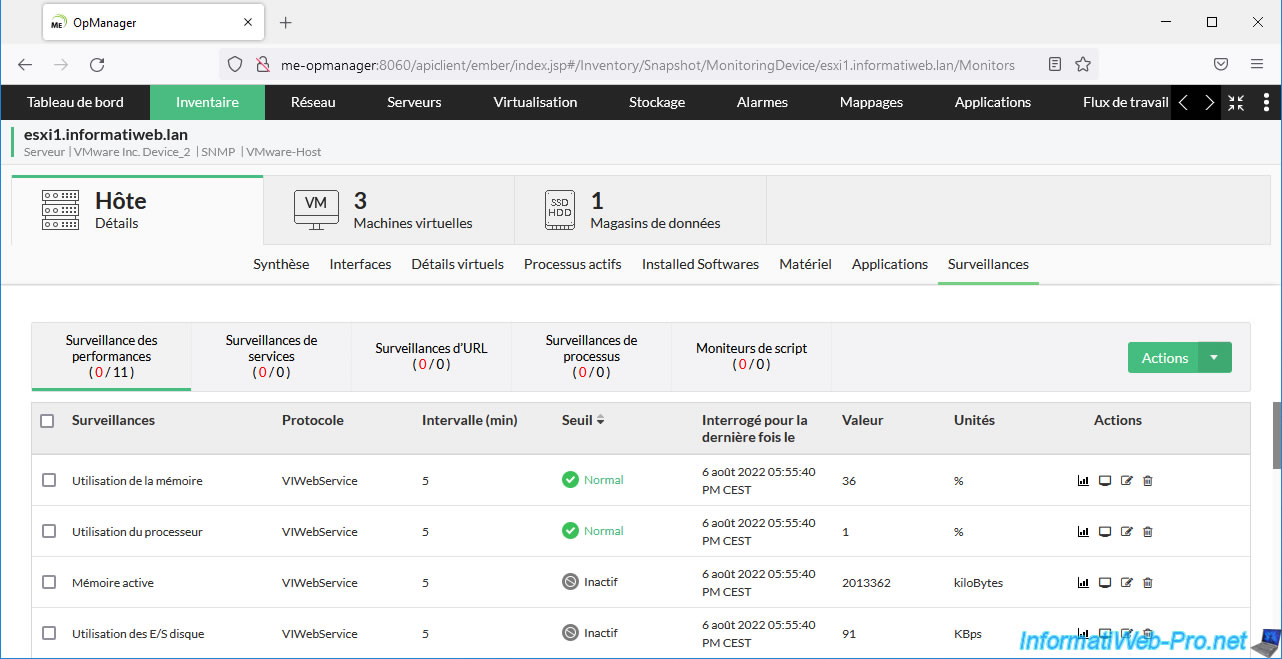
In the "Host -> Monitoring" section, you can easily monitor various settings, including the RAM and CPU usage of your VMware ESXi host.
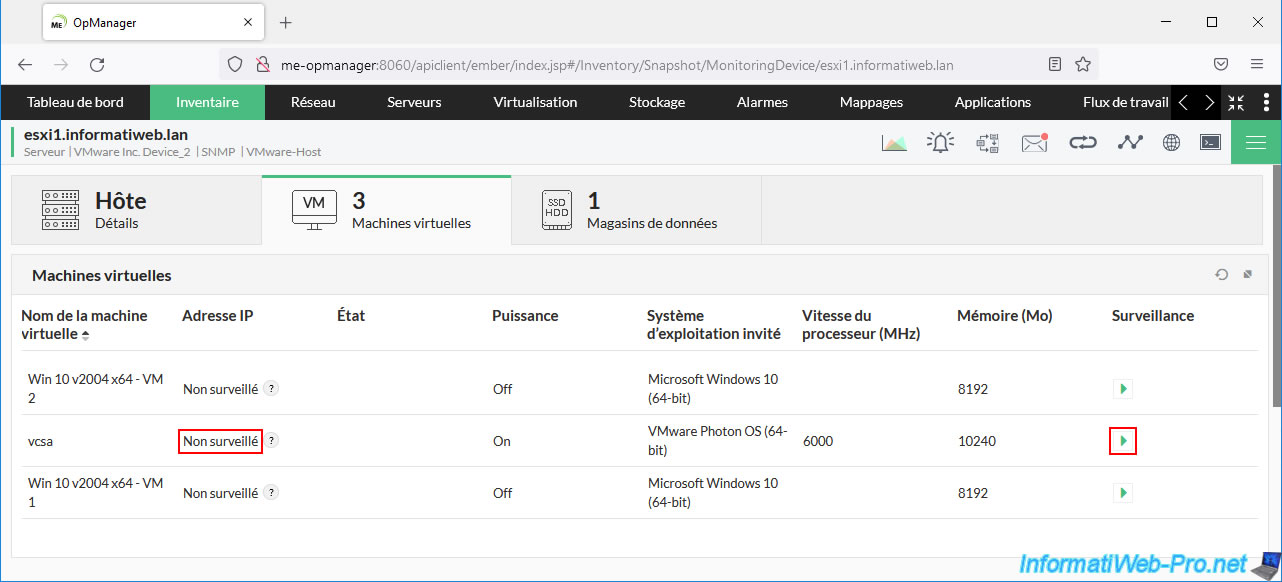
In the "Virtual Machines" section, you will be able to see the list of virtual machines currently present on this VMware ESXi host.
Note that by default these are not monitored as OpManager does not have credentials to obtain detailed information about them.
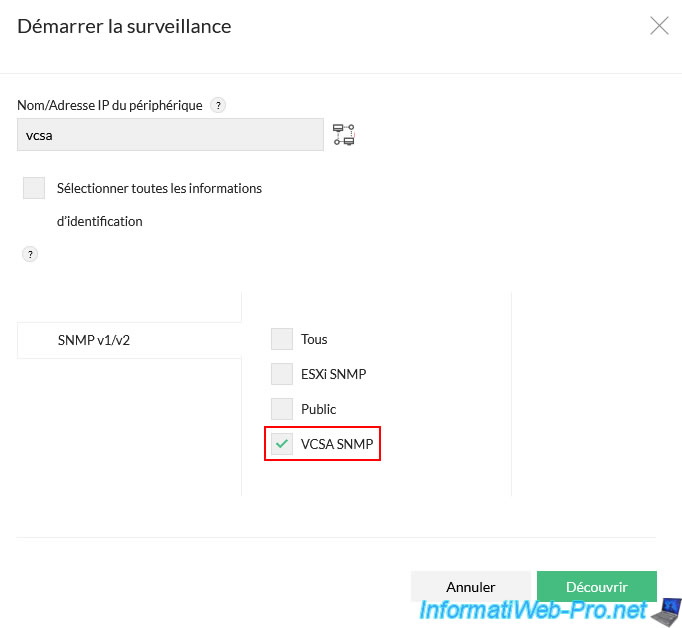
On the other hand, given that the "vcsa" virtual machine corresponds to our VMware vCenter Server Appliance (VCSA) server where we have already configured the SNMP service, we could start monitoring it by clicking on the "Play" icon located on the right.
Select the "VCSA SNMP" profile created previously and click "Discover".
The message "Started monitoring vcsa virtual machine with vcsa IP address" will appear at the top of the page.
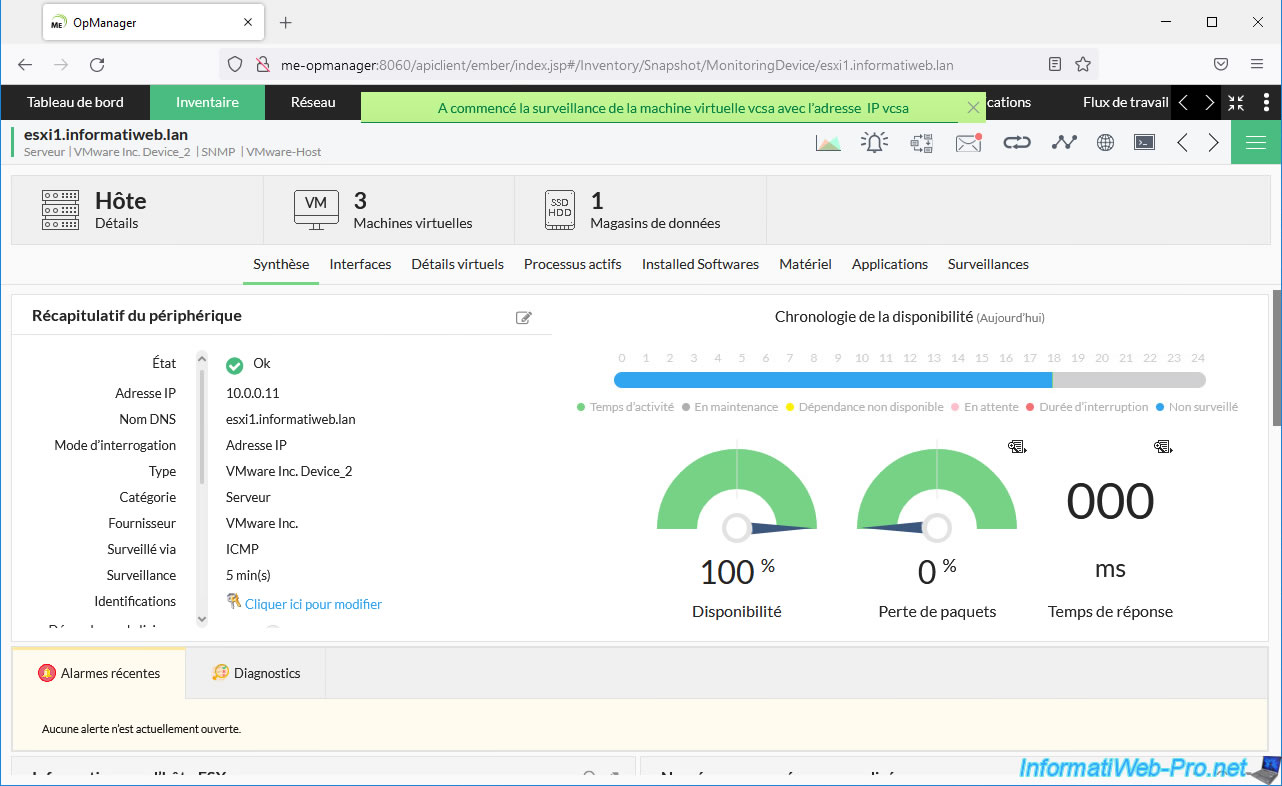
Return to the "Virtual Machines" section of your VMware ESXi host and you will see that additional information has appeared for your "vcsa" virtual machine.
![]()
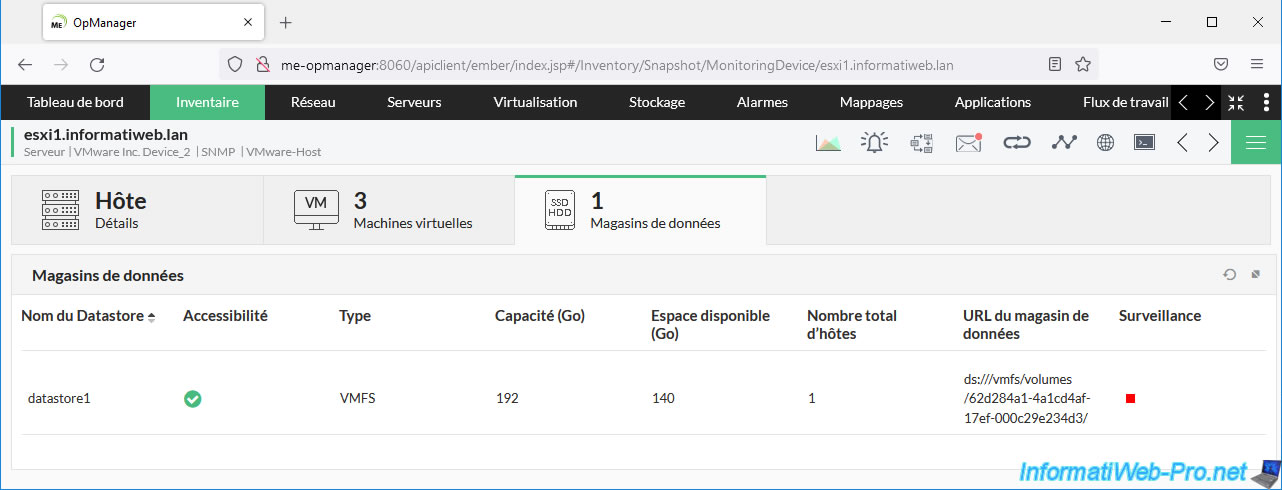
In the "Datastores" section, you will be able to see the list of datastores available on this host with:
- Datastore name: its name.
- Accessibility: its state.
- Type: the file system used on it. In general: VMFS.
- Capacity (GB): the total size of it.
- Available space (GB): the free space on it.
- Total Hosts: the number of VMware ESXi hosts that have access to it.
- Datastore URL: its system path.
- Monitoring: allows you to stop monitoring this datastore or not.
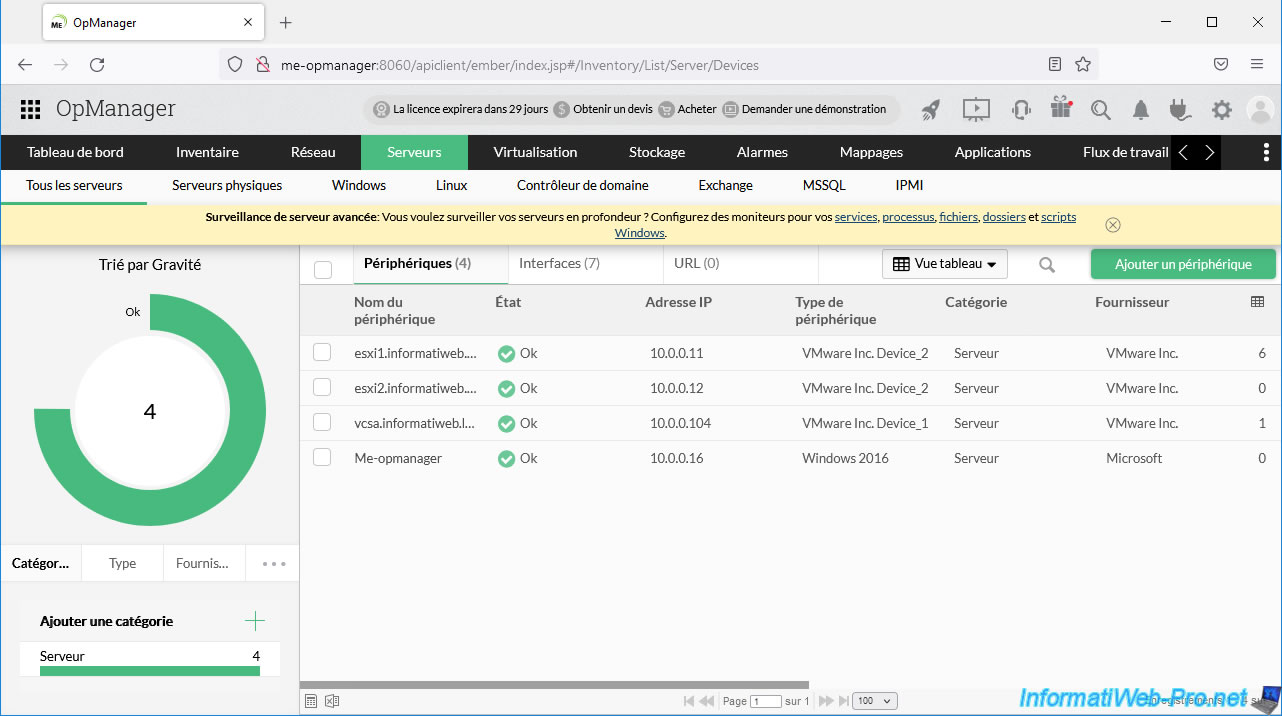
In the "Servers -> All Servers -> Devices" section, you will be able to see the list of your servers:
- your VMware ESXi hosts: esxi1 and esxi2.
- your VMware vCenter Server Appliance: vcsa.
- your monitoring server (in other words: ManageEngine OpManager): me-opmanager.
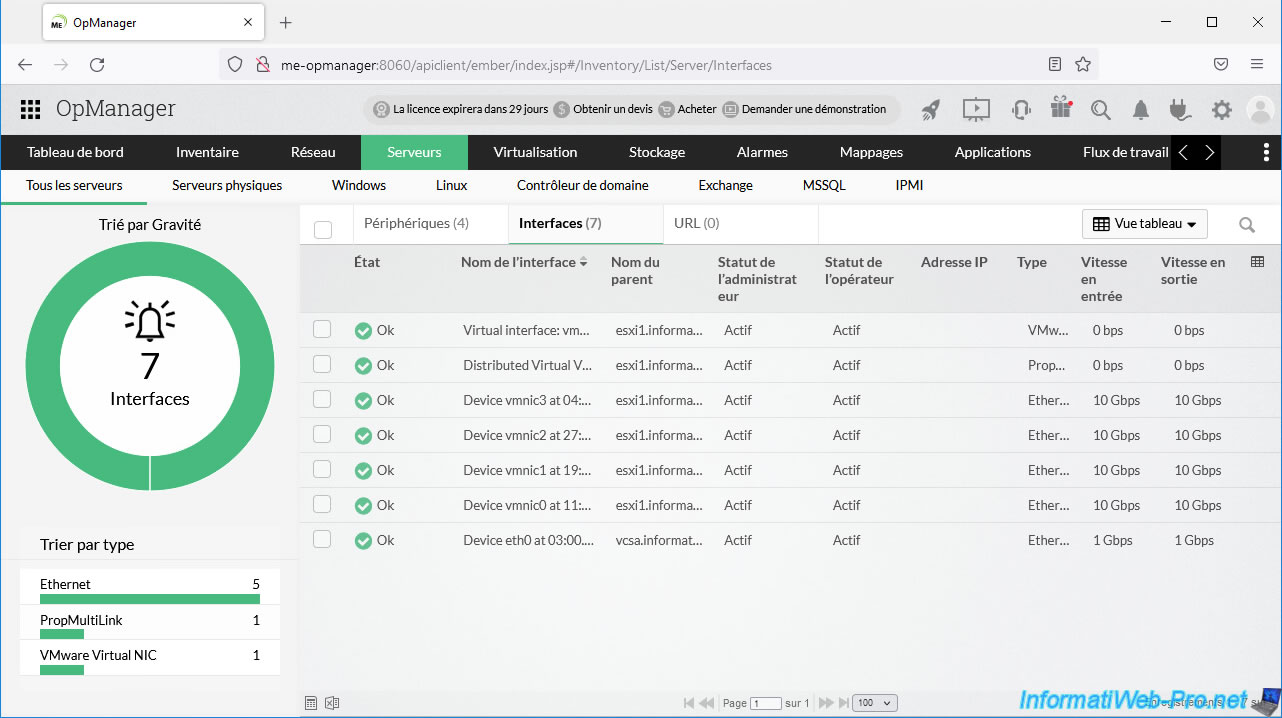
In the "Servers -> All Servers -> Interfaces" section, you will be able to see the list of your interfaces.
In our case :
- our VMkernel interface
- our virtual distributed switch (vDS)
- our physical network cards
- the VCSA server network card
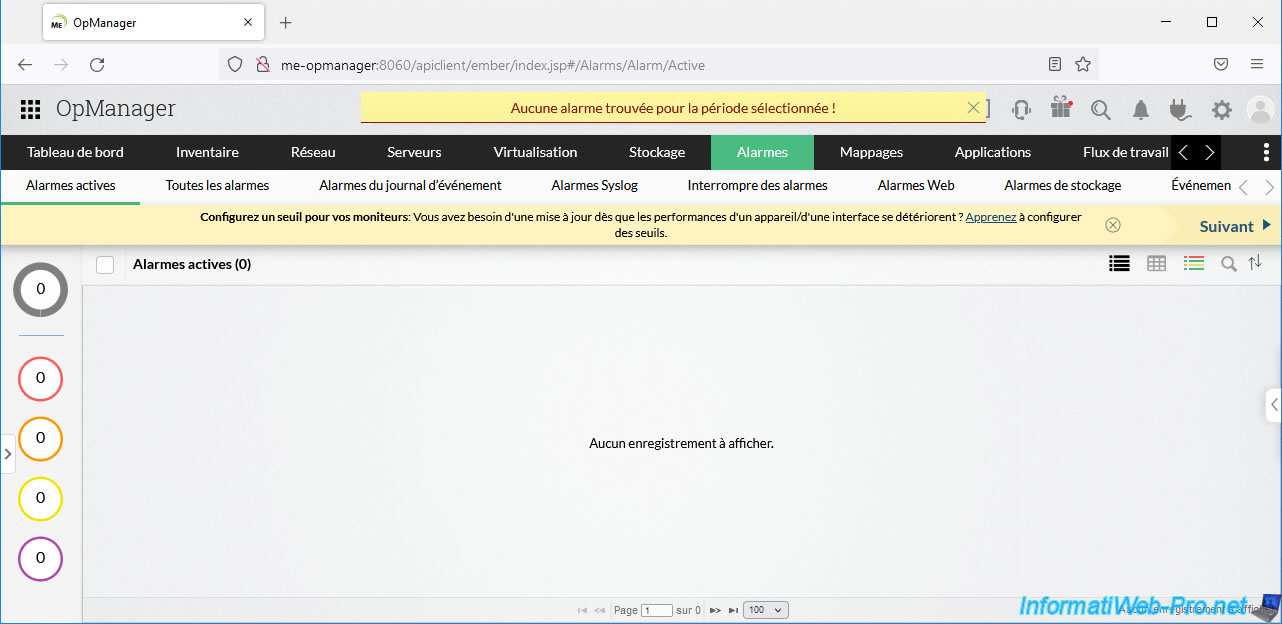
7. Alarms
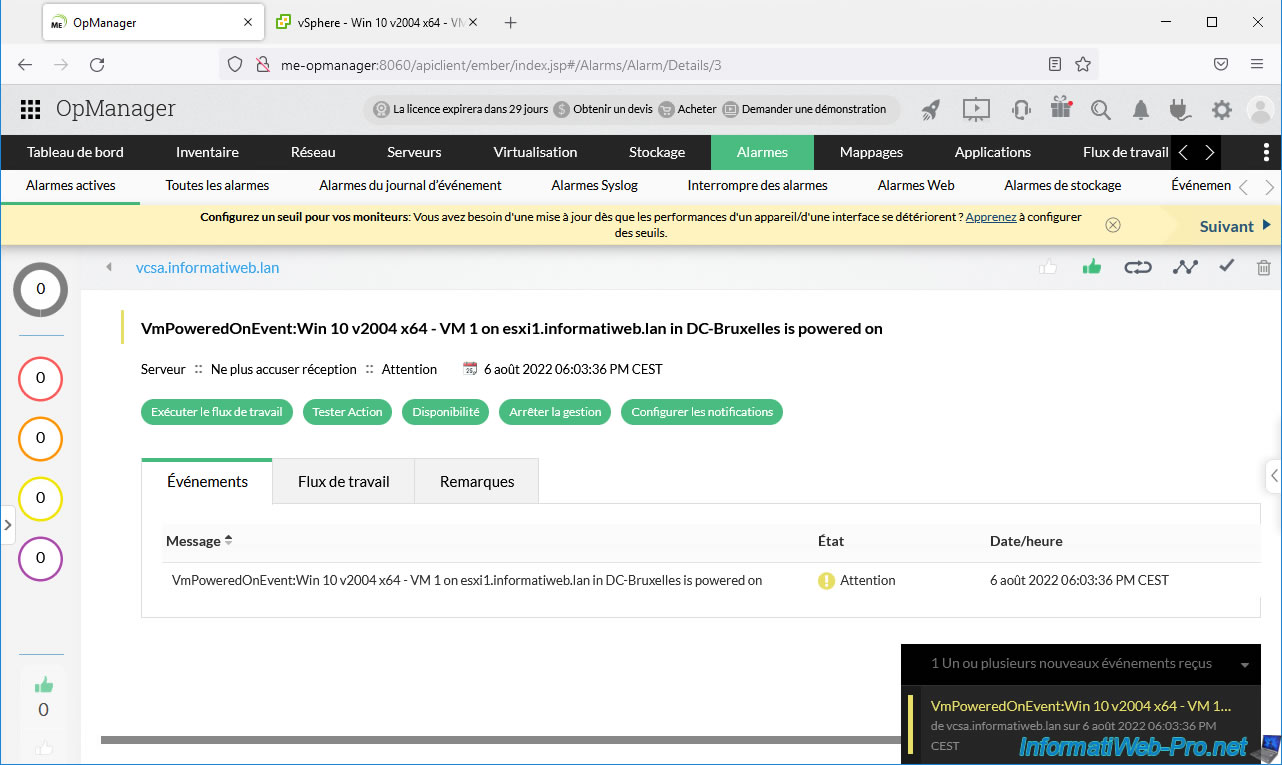
In the "Alarms" section, you will be able to see the alarms that have been triggered based on some events.
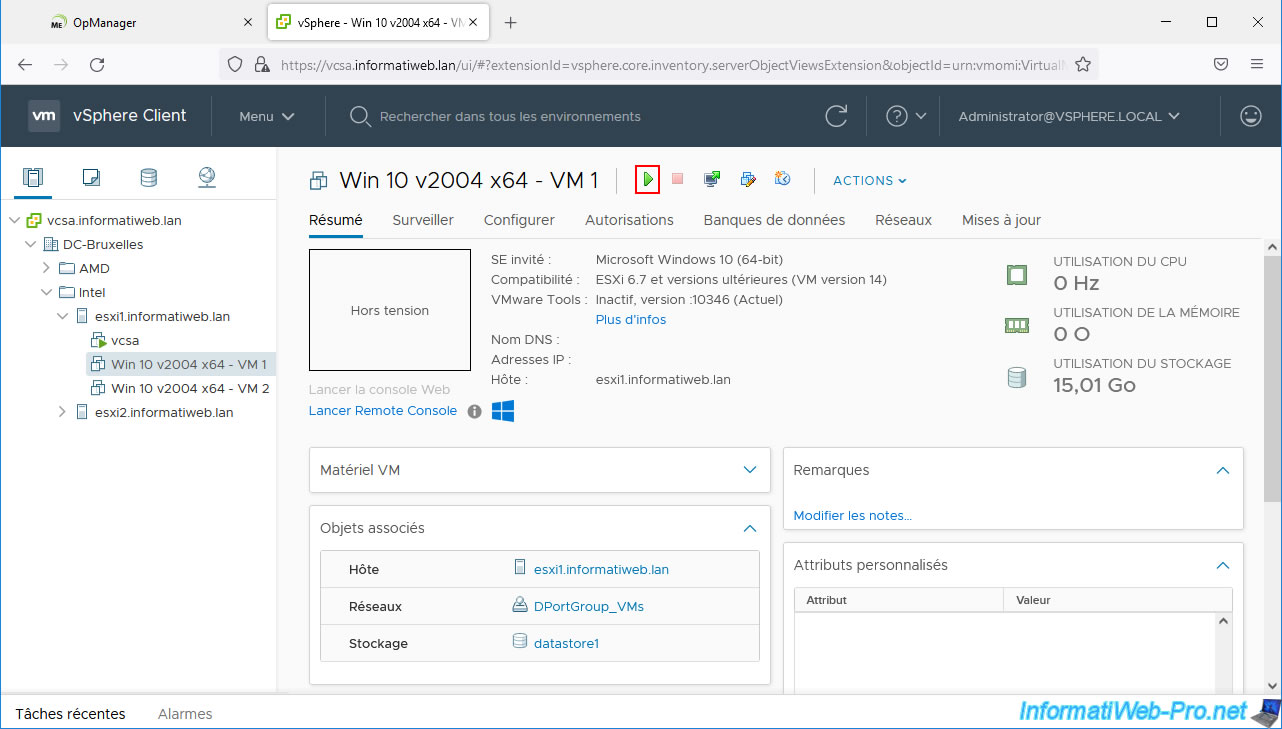
For the example, start a virtual machine from your vCenter Server.
At the bottom right you will see that a new event has occurred.
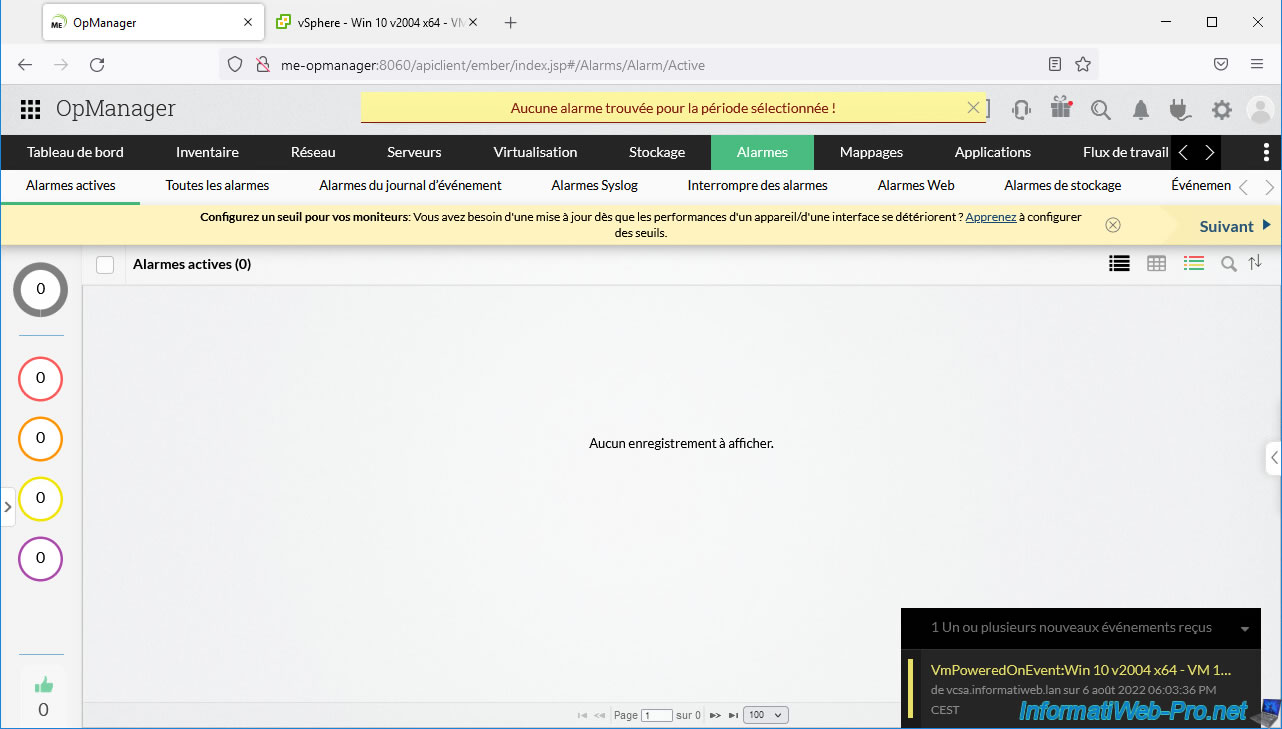
If you click on it, you will see information appear.
For example, when starting a virtual machine, you will see that a "VmPoweredOnEvent" event has been detected.
Plain Text
VmPoweredOnEvent:Win 10 v2004 x64 - VM 1 on esxi1.informatiweb.lan in DC-Bruxelles is powered on
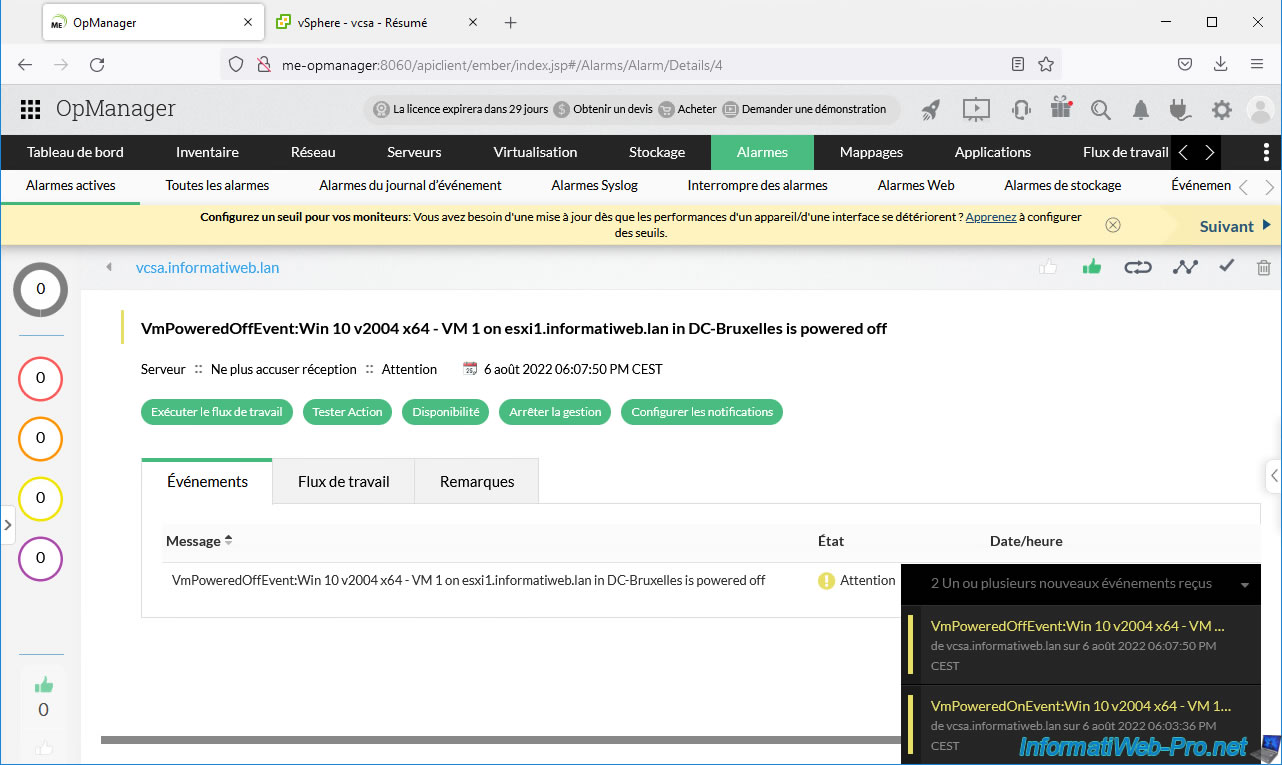
Same if you shut down a virtual machine, a "VmPoweredOffEvent" event will occur.
Share this tutorial
To see also
-
VMware 8/21/2024
VMware vSphere 6.7 - Add a VMkernel interface
-
VMware 8/2/2024
VMware vSphere 6.7 - Collect logs with SexiLog
-
VMware 8/9/2024
VMware vSphere 6.7 - Collect logs with VMware Aria Operations for Logs
-
VMware 1/10/2025
VMware vSphere 6.7 - Create a LACP link (LAG)
No comment