- VMware
- 29 January 2025 at 16:05 UTC
-

- 1/3

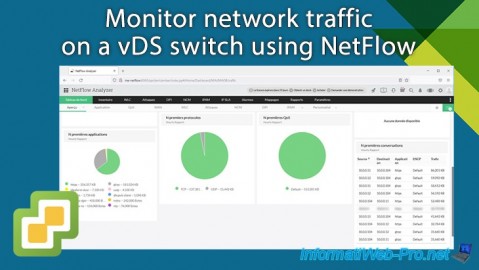
When you connect your virtual machines to a virtual distributed switch (vDS), you have the ability to see the network traffic passing through it using NetFlow.
Unlike the standard virtual switch (vSS) where you have no way to see what's happening there.
As you will see in this tutorial, to see the network traffic of your virtual distributed switch (vDS), you will need a NetFlow collector.
In our case, we used the "ManageEngine NetFlow Analyzer" program, which you can easily download, install and configure under Windows Server.
Moreover, no registration is required to download and install it.
It is also this program that is cited in the VMware "VMware vSphere 5.0 Evaluation Guide – Volume Three" (in French) document (on page 26).
- Download and install ManageEngine NetFlow Analyzer
- Export of flows impossible via SNMP
- Enable NetFlow on your Virtual Distributed Switch (vDS)
- Enable NetFlow on your distributed port groups
- NetFlow information collected
- Spotting a high download on your network
1. Download and install ManageEngine NetFlow Analyzer
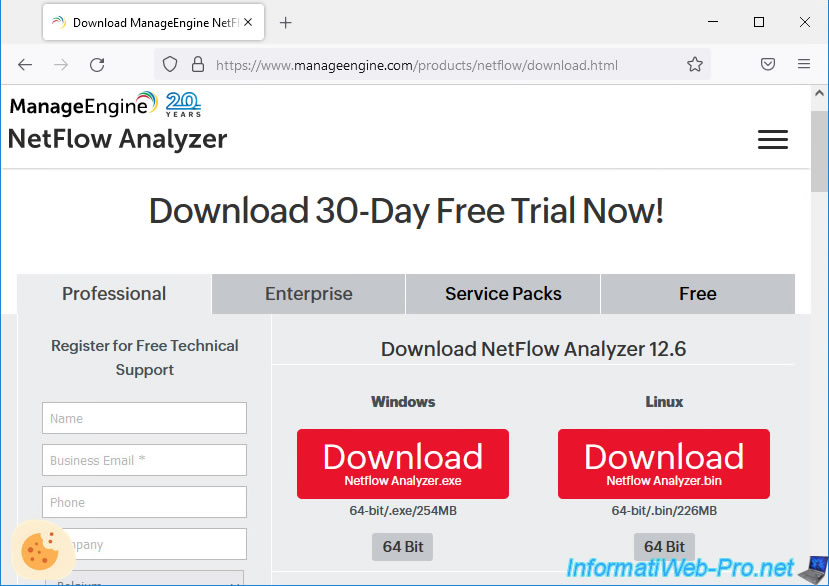
To get started, download the trial version of ManageEngine NetFlow Analyzer Professional from the official ManageEngine website.
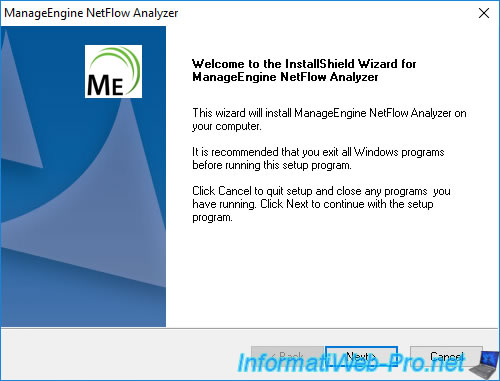
Once the file is downloaded, launch it. The "ManageEngine NetFlow Analyzer" installer will appear.
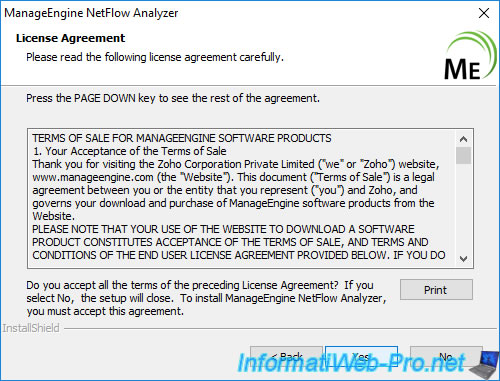
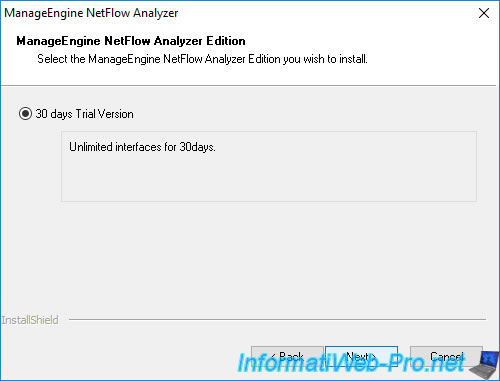
Accept the license agreement for this program.
As you can see, you will be able to use an unlimited number of interfaces during the 30-day trial period.
Leave the destination folder as default.

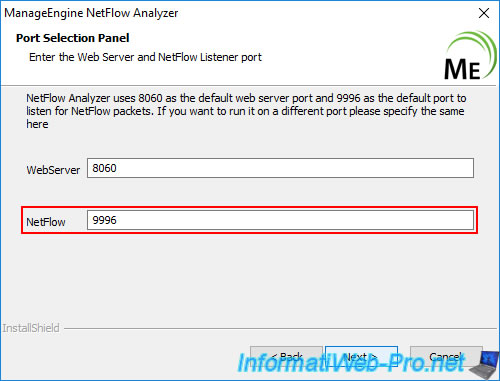
As you can see, the ManageEngine NetFlow Analyzer program uses 2 ports:
- WebServer: 8060. For access to the ManageEngine NetFlow Analyzer web interface.
- NetFlow: 9996. The port used for the NetFlow protocol. This is the port that you will need to enter later in the NetFlow settings of your virtual distributed switch (vDS).
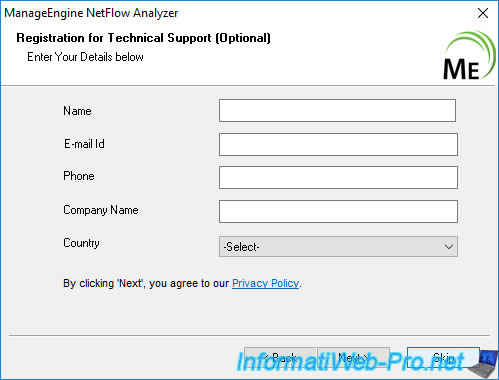
Skip the optional technical support form by clicking: Skip.
Wait while ManageEngine NetFlow Analyzer installs.
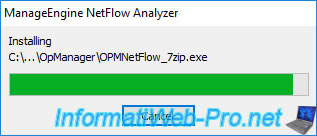
The message "Extracting files" will appear.
Then, an "Initialising database" message will appear.
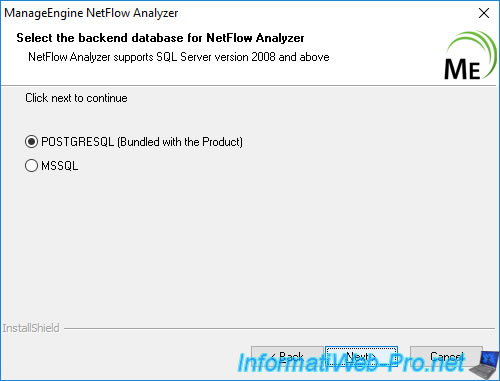
A wizard will ask you which database you want to use:
- POSTGRESQL (Bundled with the Product): use a POSTGRESQL database provided with this program.
- MSSQL: store the database on an existing Microsoft SQL Server. But, this requires additional configurations.
In our case, we will use the "POSTGRESQL (Bundled with the Product)" option so as not to lengthen this tutorial unnecessarily.
At the end of the wizard, uncheck the "View Readme" box and click Finish.
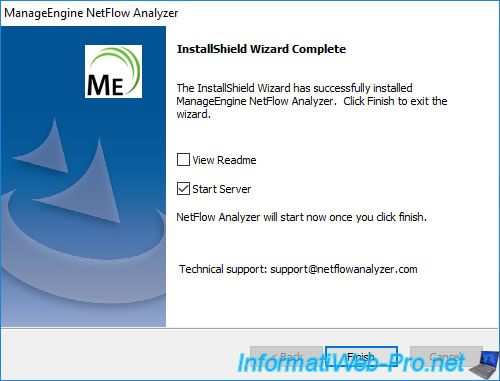
The message "Starting NetFlow Analyzer" appears.
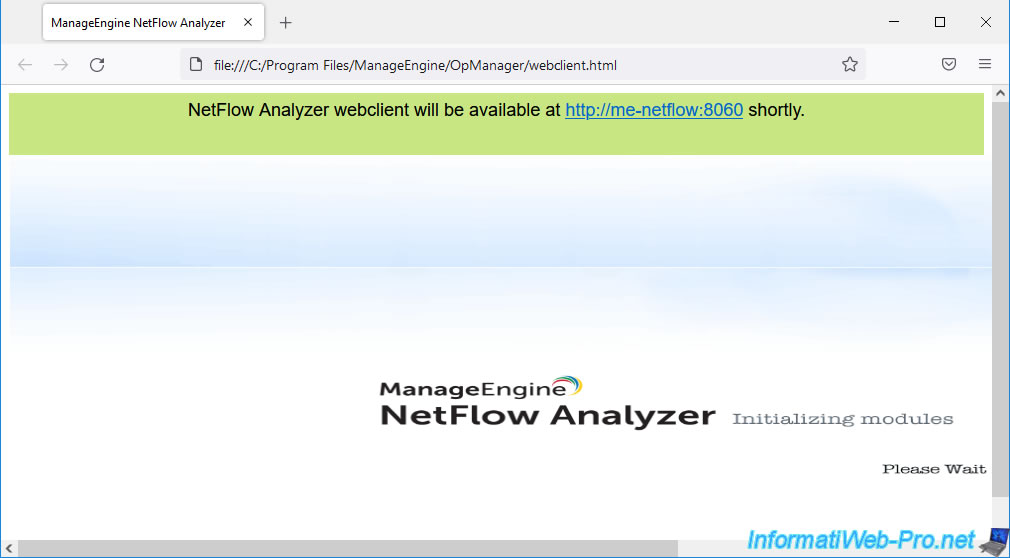
This page will appear temporarily after installing ManageEngine NetFlow Analyzer.
Plain Text
NetFlow Analyzer webclient will be available at http://me-netflow:8060 shortly.
ManageEngine NetFlow Analyzer - Initializing modules - Please Wait.
2. Export of flows impossible via SNMP
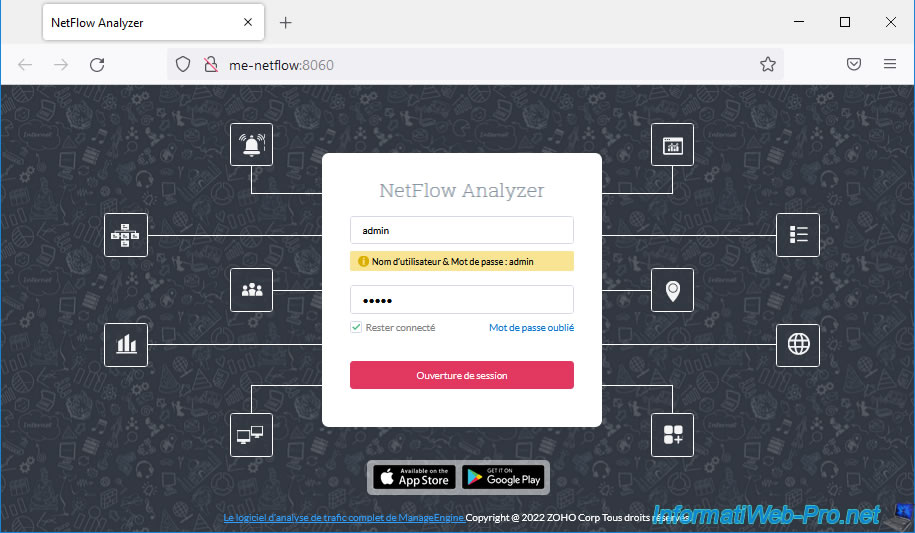
Once the web client initialization is complete, a "NetFlow Analyzer" login page will appear and tell you that the default credentials are: admin / admin.
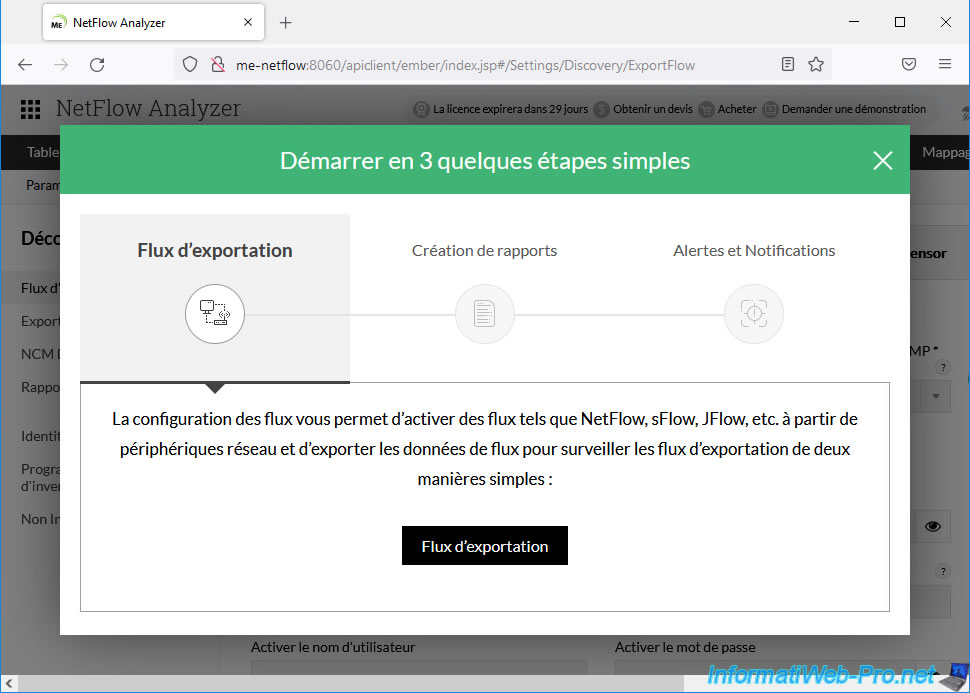
Once logged in as admin, the ManageEngine NetFlow Analyzer web client that configures flows allows you to activate NetFlow flows, ...
Click the button: Export Flow.
However, if you enable SNMP v1/v2c on your VCSA server and provide the domain name of your VCSA server, the root account credentials to connect via SSH and the correct SNMP credentials in the form below, you will see that it will not work.
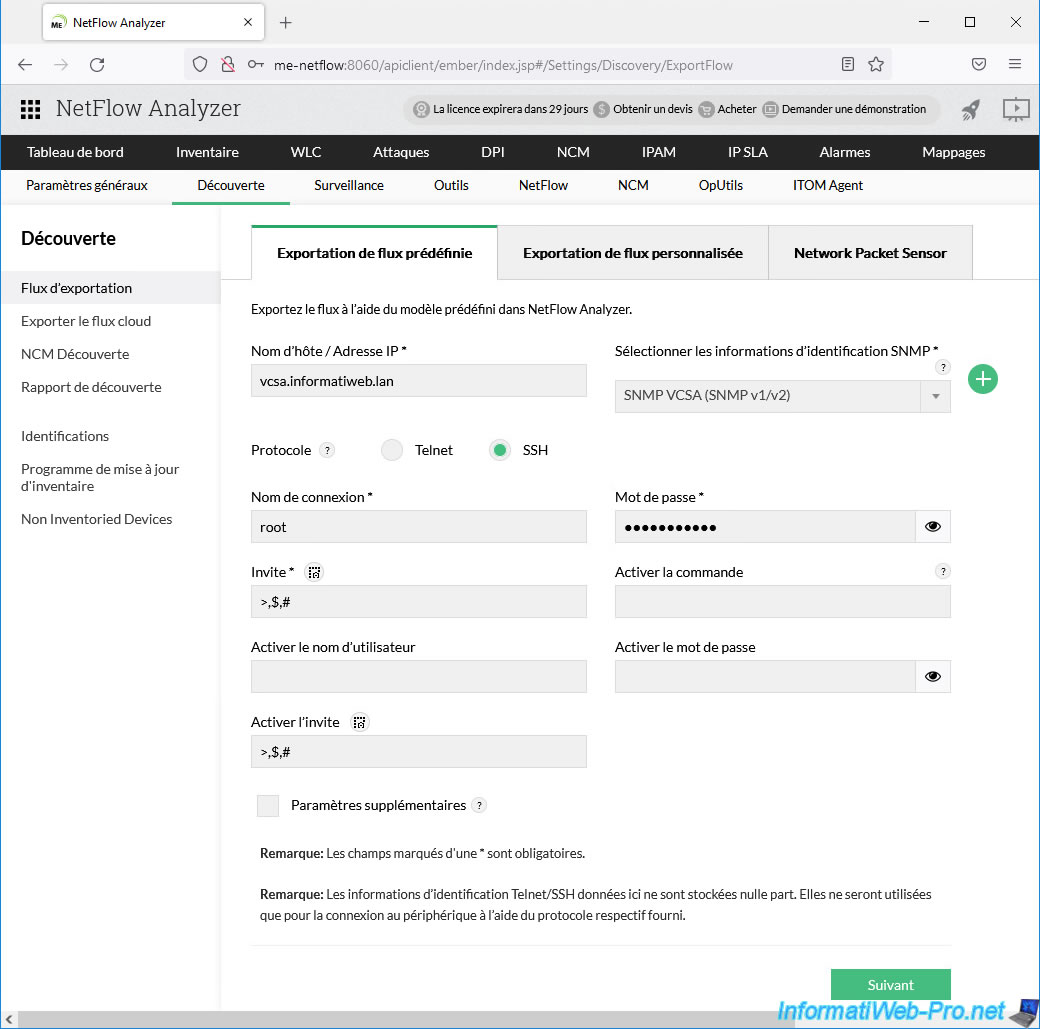
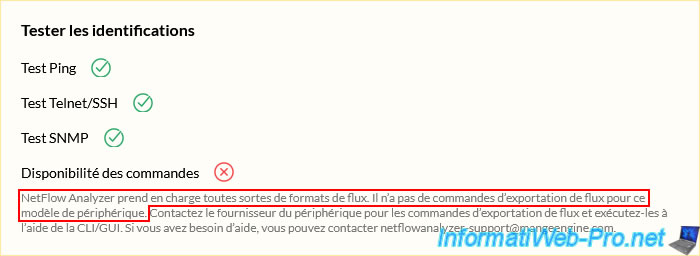
Indeed, although all the information indicated is correct, ManageEngine NetFlow Analyzer will tell you that it supports many flow formats, but that it does not have flow export commands for the targeted server (in this case : VCSA).
Plain Text
NetFlow Analyzer supports all kinds of flow formats. It does not have stream export commands for this device model.
Share this tutorial
To see also
-
VMware 8/21/2024
VMware vSphere 6.7 - Add a VMkernel interface
-
VMware 8/2/2024
VMware vSphere 6.7 - Collect logs with SexiLog
-
VMware 8/9/2024
VMware vSphere 6.7 - Collect logs with VMware Aria Operations for Logs
-
VMware 1/10/2025
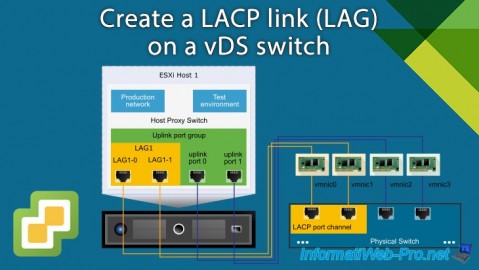
VMware vSphere 6.7 - Create a LACP link (LAG)
You must be logged in to post a comment