Deploy SexiGraf on VMware vSphere 6.7 to generate graphics for your ESXi hosts and VCSA
- VMware
- 14 August 2024 at 12:02 UTC
-

- 3/3

5. Dashboards (SexiPanels) available in SexiGraf
On the home page (visible after you are connected to the SexiGraf web interface), you can see graphs regarding the use of system resources (processor and RAM) by SexiGraf.
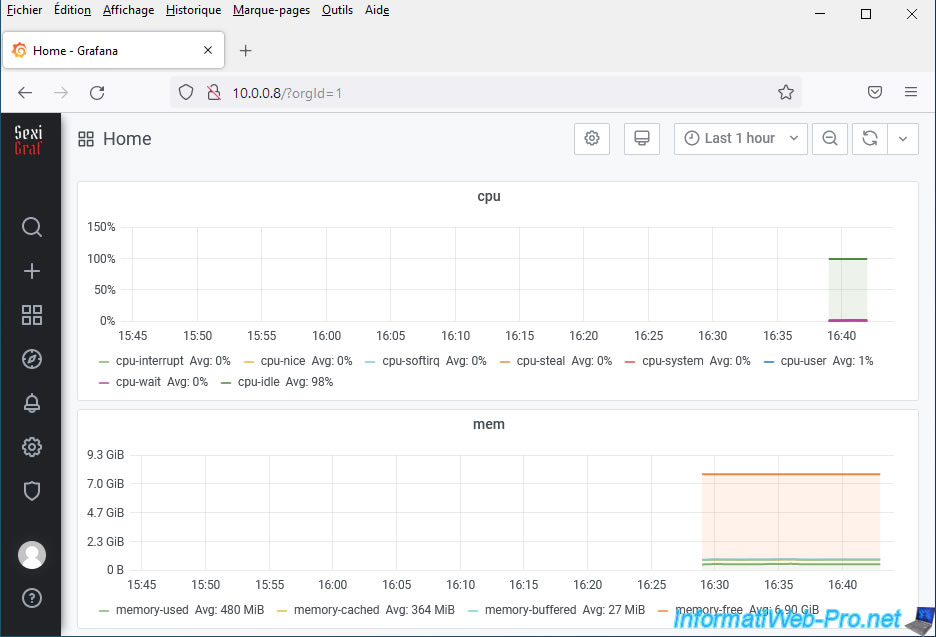
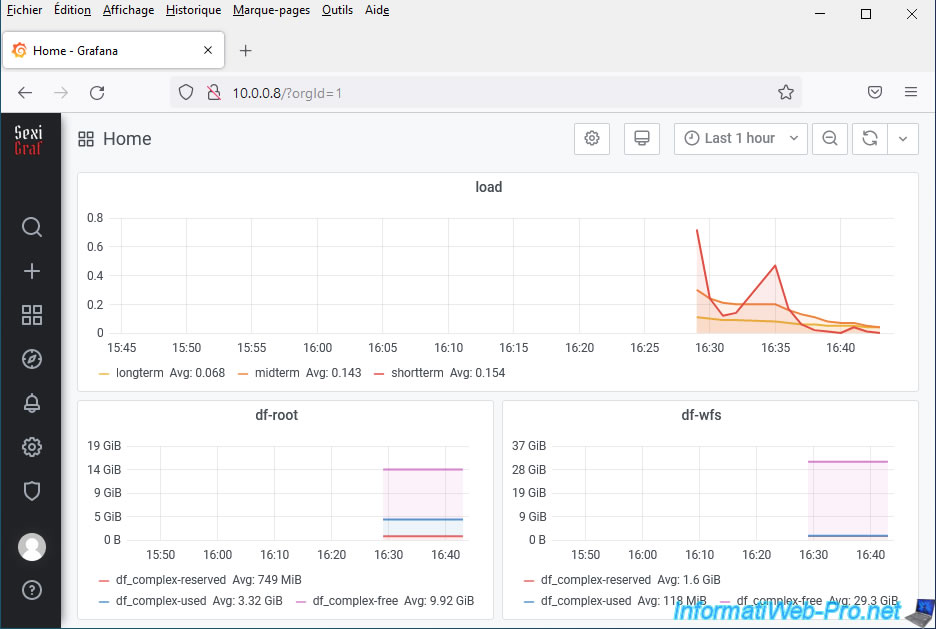
Below, you will also find a performance graph regarding system load.
For the 2 graphs "df-root" and "df-wfs", this refers to the storage space reserved, used and free for:
- df-root: the root of the file system (including "/") which corresponds to the LVM logical volume "/dev/mapper/sexigraf--vg-root".
- df-wfs: the "/mnt/wfs" mount point.
To check this, log in as "root" to the SexiGraf console and use the command:
Bash
df -h
Which will show you this:
Plain Text
Filesystem                     Size  Used Avail Use% Mounted on
...
/dev/mapper/sexigraf--vg-root   14G  3.4G   10G  26% /
...
/dev/sdb1                       32G  126M   30G   1% /mnt/wfs
...
Source : GitHub de sexigraf - collectd.conf (ligne 373).
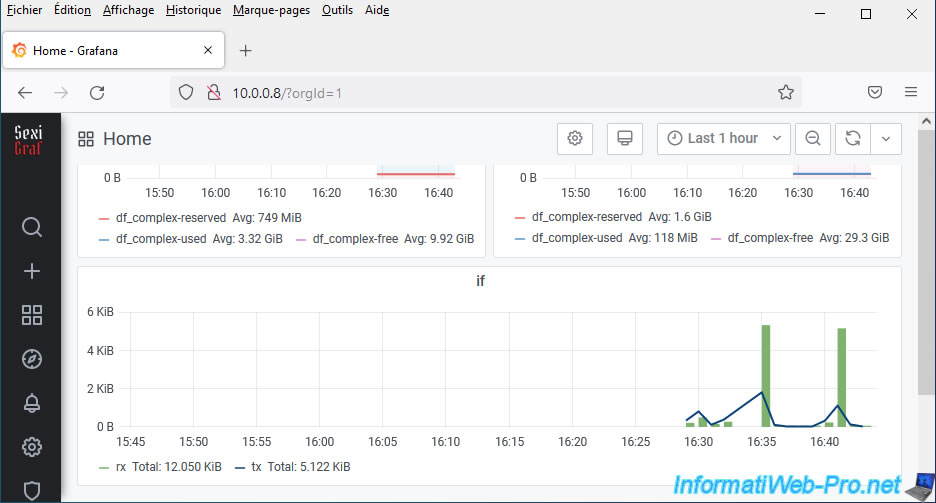
Finally, you will find a graph concerning the data transferred via the "ens192" network card used by SexiGraf.
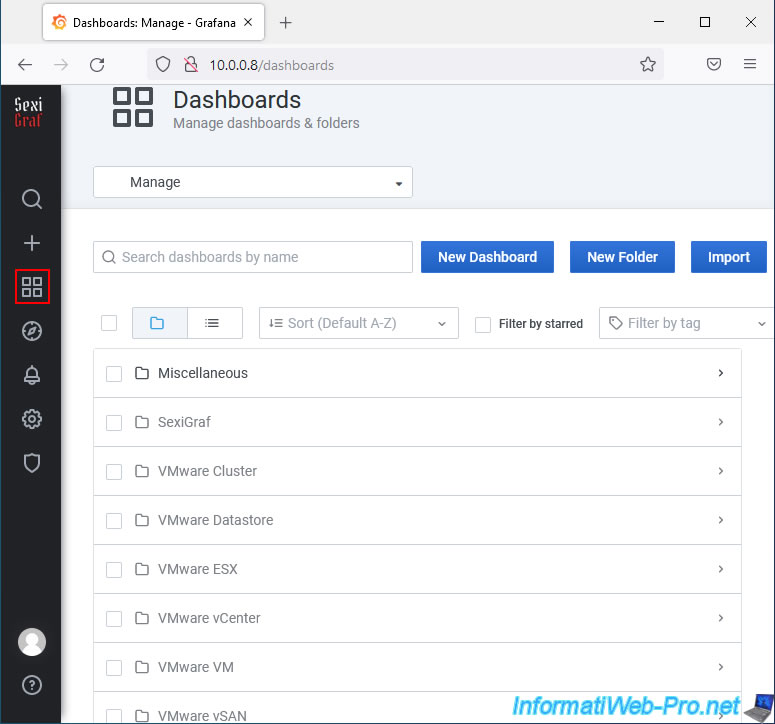
In the case of a VMware vCenter Server (or VCSA), you may find some interesting graphs.
To do this, go to: Dashboards -> Manage.
As you can see, you will find different categories of dashboards:
- Miscellaneous: allows you to obtain graphs concerning a FreeNAS server, the SMART status of its hard drives, ...
- SexiGraf: allows you to manage the configuration of SexiGraf, as well as to obtain graphics concerning the internal functioning of SexiGraf (components: Apache, Graphite Carbon, ...).
- VMware Cluster: allows you to obtain graphs concerning the use of resources (CPU, RAM, network, ...) when your servers are members of a cluster.
You will also be able to obtain graphs regarding migrations via vMotion. - VMware Datastore: provides graphs of datastore usage.
- VMware ESX: allows you to obtain graphs regarding the resource usage (CPU / RAM), number of virtual machines and datastore sharing (if applicable) of your ESX hosts.
Note that these dashboards also work if you have added only one VMware vCenter Server in the SexiGraf configuration. - VMware vCenter: allows you to monitor the number of active sessions on your VMware vCenter Server, bad events and alerts.
- VMware VM: allows you to monitor the use of resources (processor, RAM, network, ...) by your different virtual machines.
- VMware vSAN: allows you to monitor your VMware vSAN servers if you have them and to monitor the use of disk space on them.
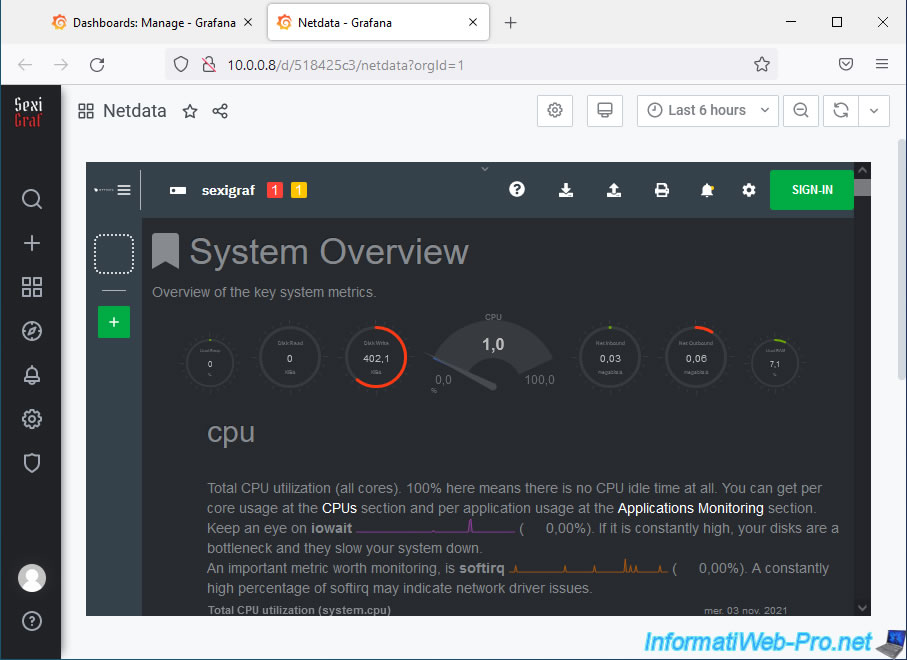
Thanks to the "SexiGraf -> Netdata" dashboard, you can monitor the use of the processor, virtual hard disk, RAM, ... by the sexigraf virtual machine.
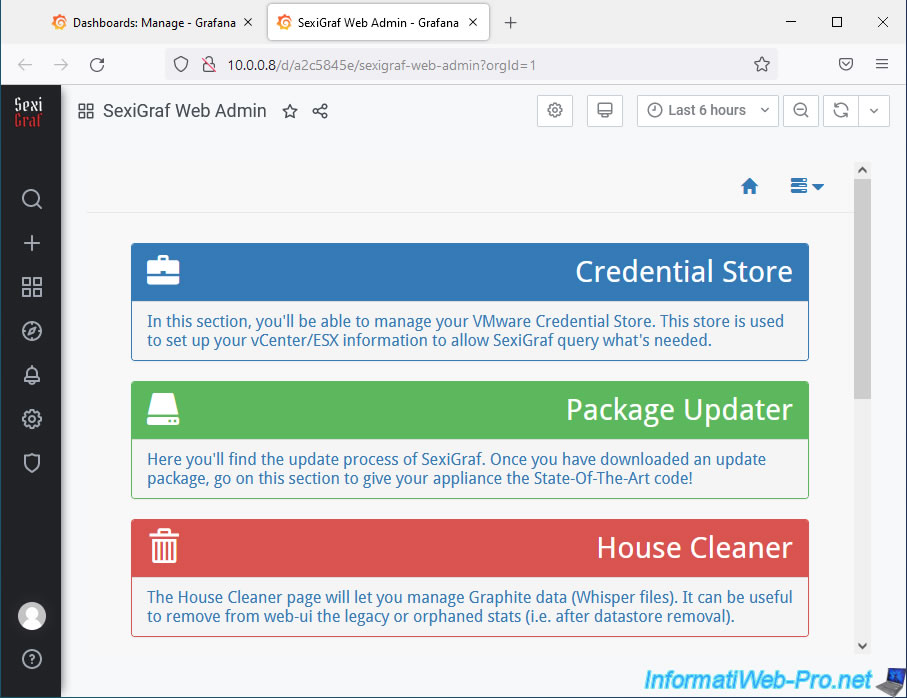
Thanks to the "SexiGraf -> SexiGraf Web Admin" dashboard, you will be able to:
- Credential Store: manage the different VMware vCenter Server and/or VMware ESXi servers that you want to monitor via SexiGraf.
- Package Updater: allowed you to update SexiGraf by specifying an update file in ".sup" format available on their official GitHub.
However, this is no longer possible since version 0.99g "Ravenholm" (as indicated on their official GitHub). - House Cleaner: allows you to clean your sexigraf virtual machine to free up disk space.
You can also automatically delete files older than 120 days (4 months) by activating auto-purge. - Refresh Inventory: by default, the offline VI inventory is updated every 6 hours.
However, in the event of a problem, you can trigger this update manually by clicking a simple button. - Log Viewer: allows you to view the end of the SexiGraf log file "/var/log/sexigraf/getInventory.log". Which can be useful in the event of a problem encountered with SexiGraf.
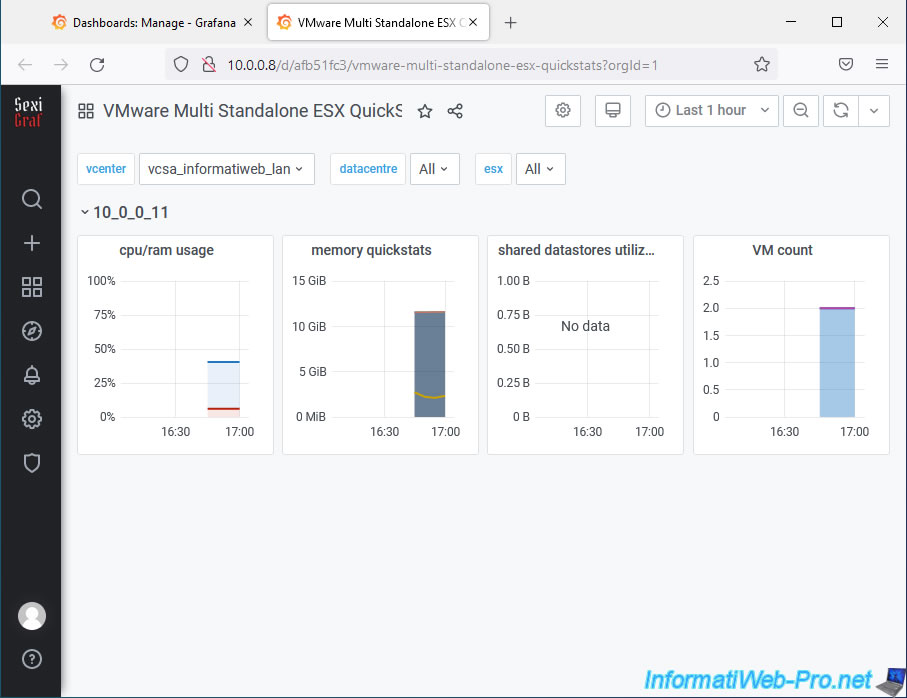
Thanks to the "VMware ESX -> VMware Multi Standalone ESX QuickStats" dashboard, you can monitor usage:
- processor (CPU)
- memory (RAM)
- shared datastores (if applicable)
- the number of virtual machines used
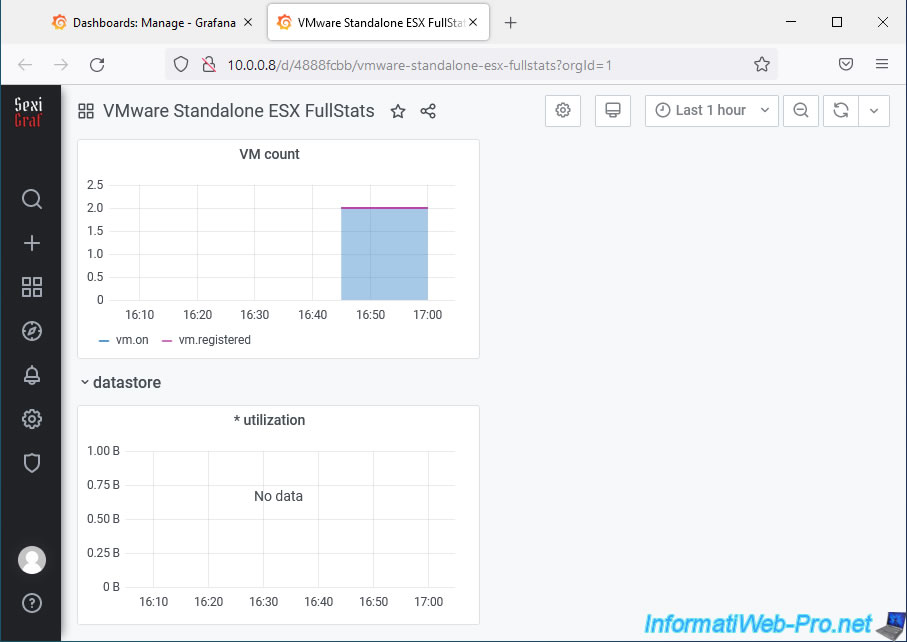
Thanks to the "VMware ESX -> VMware Standalone ESX FullStats" dashboard, you can monitor usage:
- of processor
- of RAM
You will thus be able to easily detect the use of ballooned, compressed and/or swapped memory.
This should definitely be avoided, because using these types of memory indicates that you have mismanaged the RAM usage of your virtual machines.
For example, by allocating too much RAM to a virtual machine compared to what it actually consumes normally.
Or using too much RAM reservation on certain virtual machines. This prevents other virtual machines from using the RAM on your VMware ESXi host.
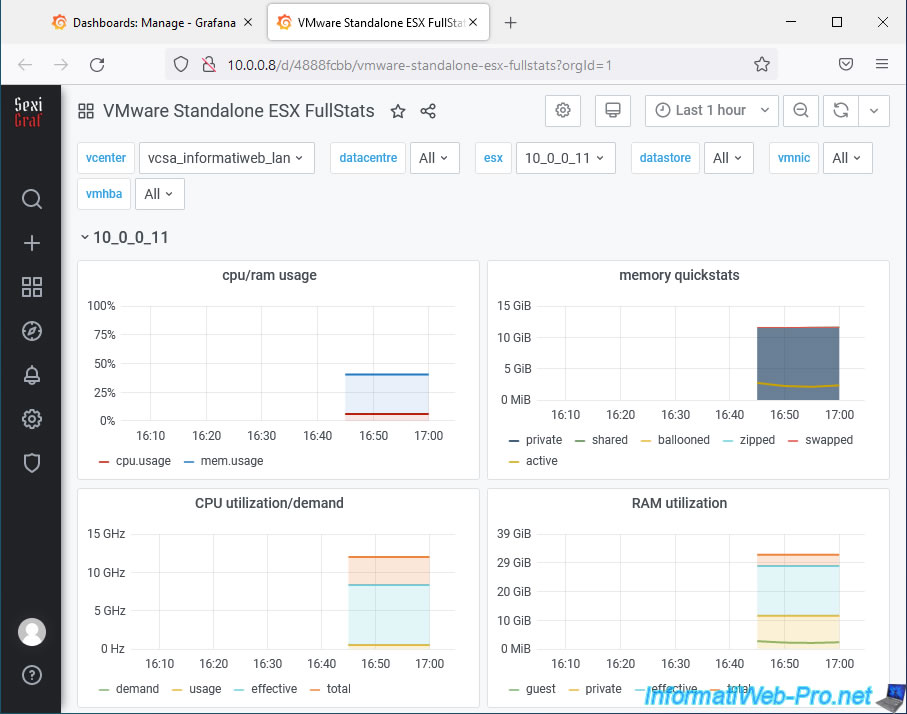
In this dashboard, you can also monitor the number of virtual machines present on a VMware ESXi host, as well as the use of the datastore (if applicable).
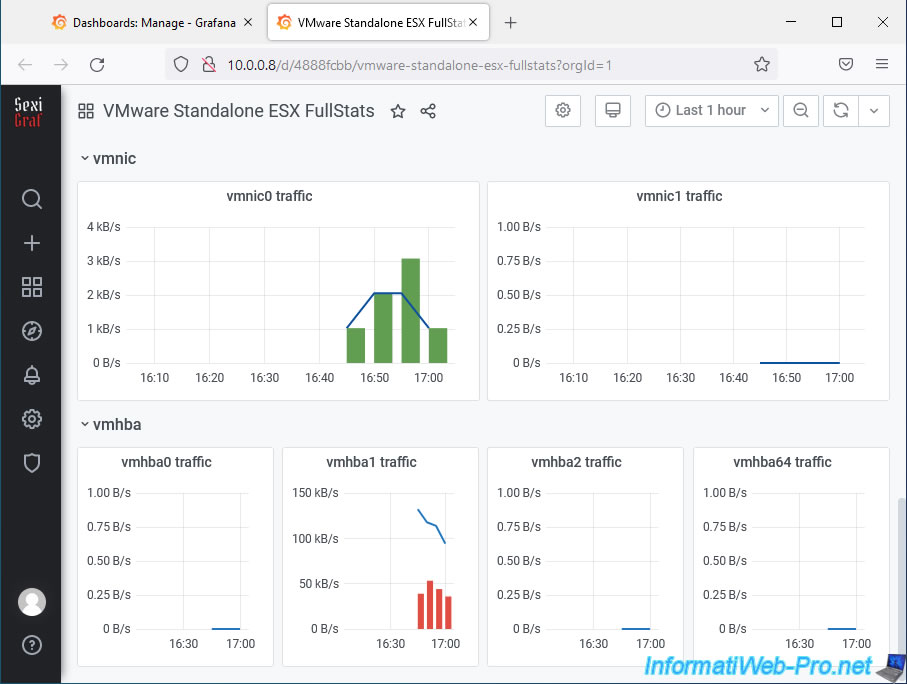
You will also be able to monitor:
- vmnic0 / vmnic1 traffic: network use by network card or rather by physical network port
- vmhba0 traffic, ...: storage usage by storage adapter/controller
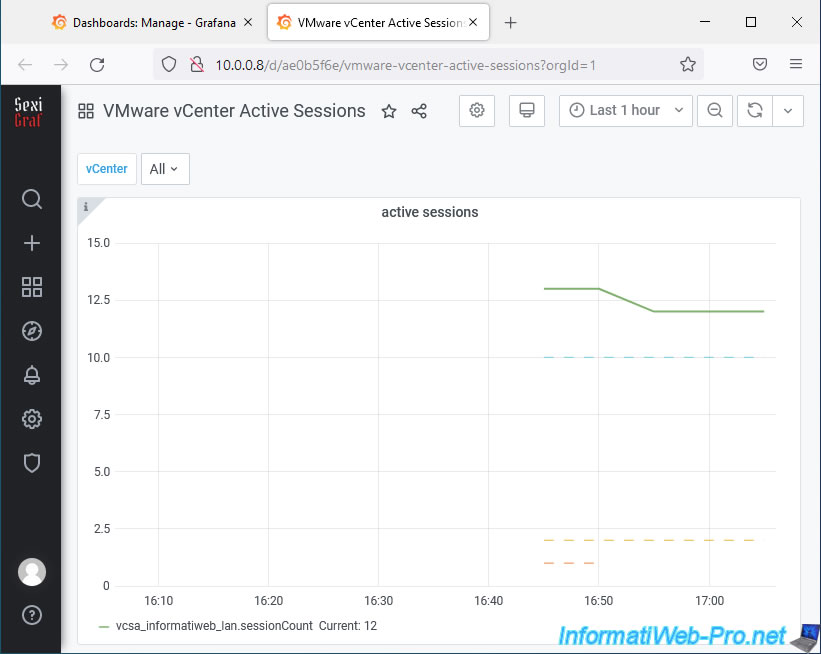
Thanks to the "VMware vCenter -> VMware vCenter Active Sessions" dashboard, you can monitor the number of active sessions on your VMware vCenter Server.
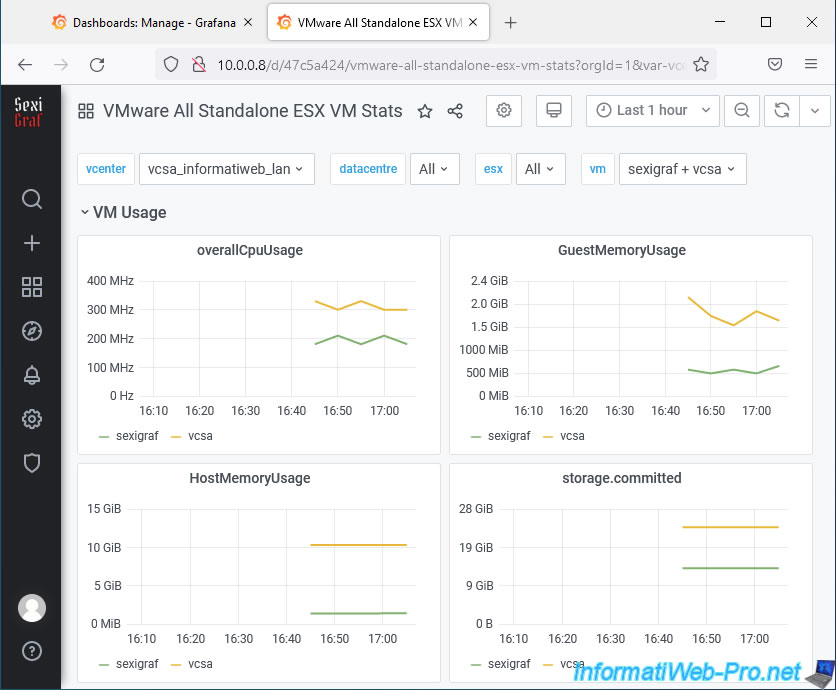
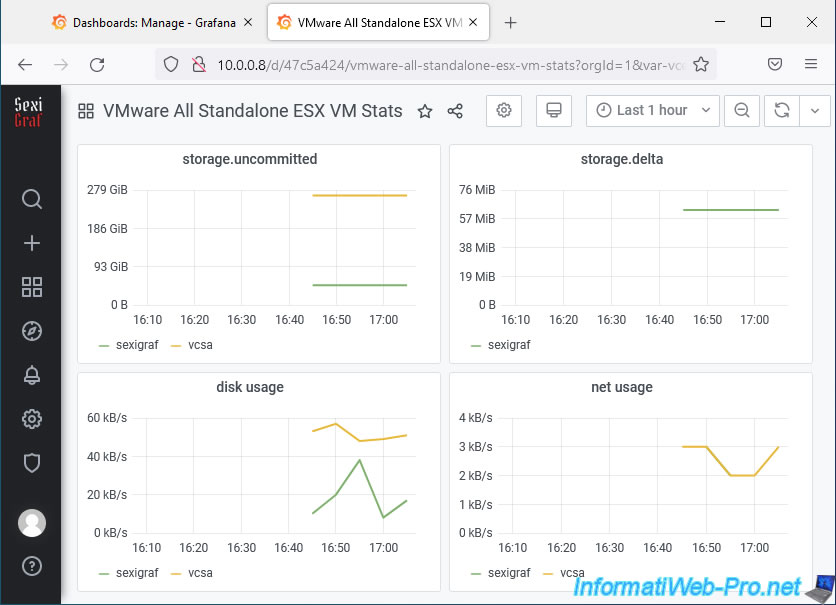
Thanks to the "VMware VM -> VMware All Standalone ESX VM Stats" dashboard, you can monitor the use of resources by each virtual machine:
- overallCpuUsage: overall processor (CPU) usage.
- GuestMemoryUsage: RAM usage in the guest OS.
- HostMemoryUsage: RAM usage on the VMware ESXi host.
- storage.commited: used storage space on the physical disk.
In the case of a statically provisioned virtual hard disk, the committed space will be equal to the provisioned space. So, it will also be equal to the maximum size of the virtual hard disk.
On the other hand, in the case of a virtual hard disk whose provisioning is dynamic, this will correspond to the space actually used in it from the guest operating system. - storage.uncommited: storage space provisioned, but not currently in use.
Assuming a virtual machine has a dynamically provisioned 80 GB virtual hard drive and only 20 GB is used in it, the uncommitted space will be 60 GB (80 GB - 20 GB). - storage.delta: allows you to monitor the "storage.delta" value for each VM.
- disk usage: allows you to monitor the storage usage rate in KB/s
- net usage: allows you to monitor the network usage rate in kb/s
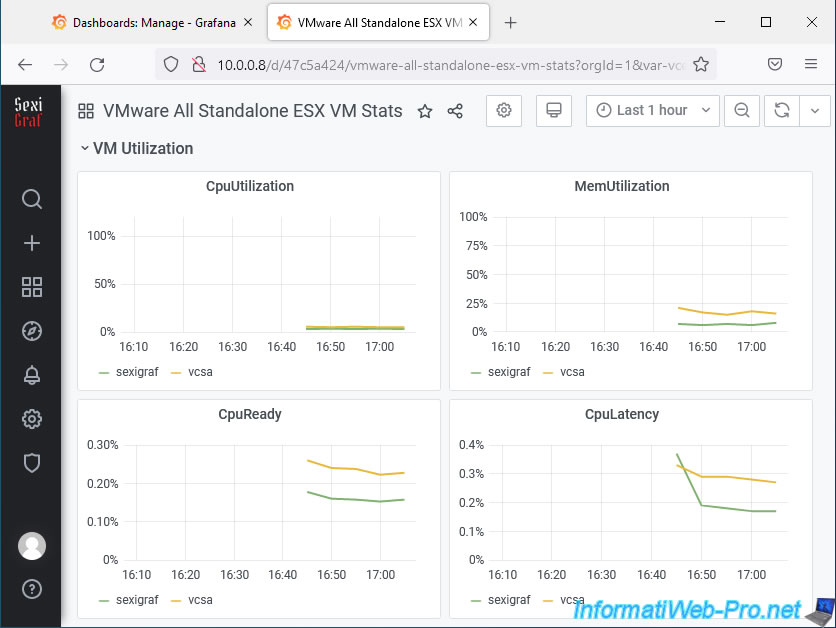
- CpuUtilization: processor (CPU) utilization rate.
- MemUtilization: RAM usage rate.
- CpuReady: allows you to see if the host processor is often available for a particular VM based on the number of cores available on the physical CPU and the number of virtual cores allocated to a virtual machine.
- CpuLatency: this value corresponds to the inverse of the previous value (CpuReady).
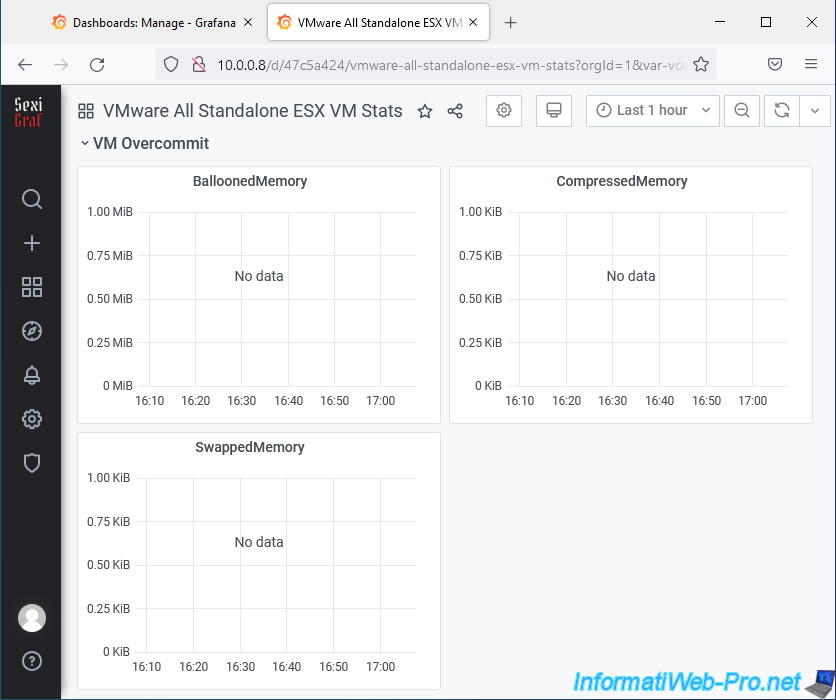
In other words, it is the time during which the physical processor is not available for the number of virtual cores allocated to a virtual machine. - BalloonedMemory: when you allocate more RAM to your virtual machines than is available on the host, VMware ESXi may attempt to reclaim memory allocated to other VMs to lend it to virtual machines that actually need it. this moment.
- CompressedMemory: concerns the compression of memory pages. This happens when the RAM available on the host becomes insufficient.
- SwappedMemory: indicates that the host is using swap files (the performance of which is therefore significantly lower than that of RAM) to try to compensate for a lack of RAM on the host.
Important : note that if data appears in at least one of the last 3 graphs (BalloonedMemory / CompressedMemory / SwappedMemory), this means that you should adjust the RAM allocated to your virtual machines, migrate it to other hosts, ...
Indeed, the use of these 3 techniques to recover RAM causes a loss of performance on the host concerned.
6. Plugins
Finally, you will also find a "Configuration -> Plugins" section allowing you to add features and also monitor other types of servers or applications.
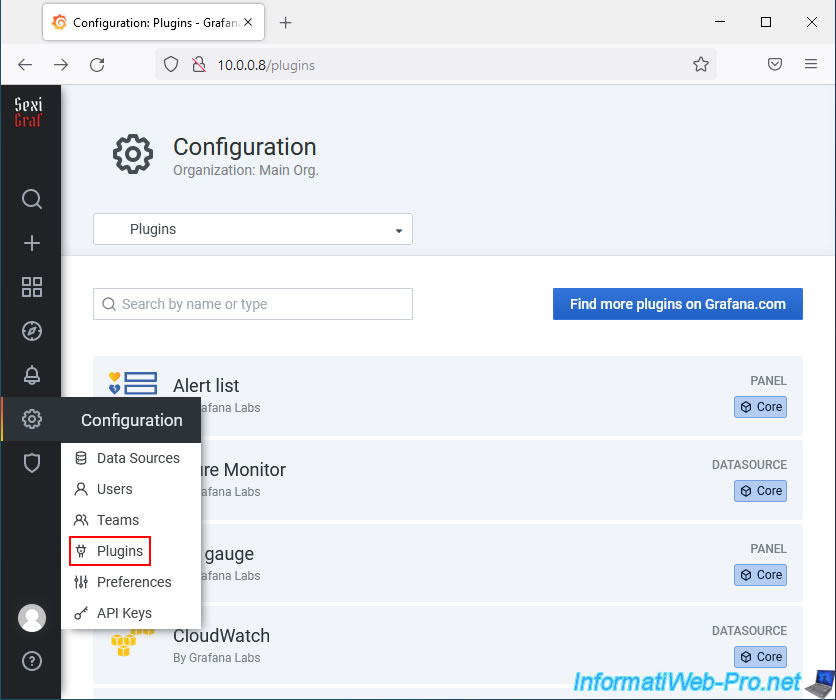
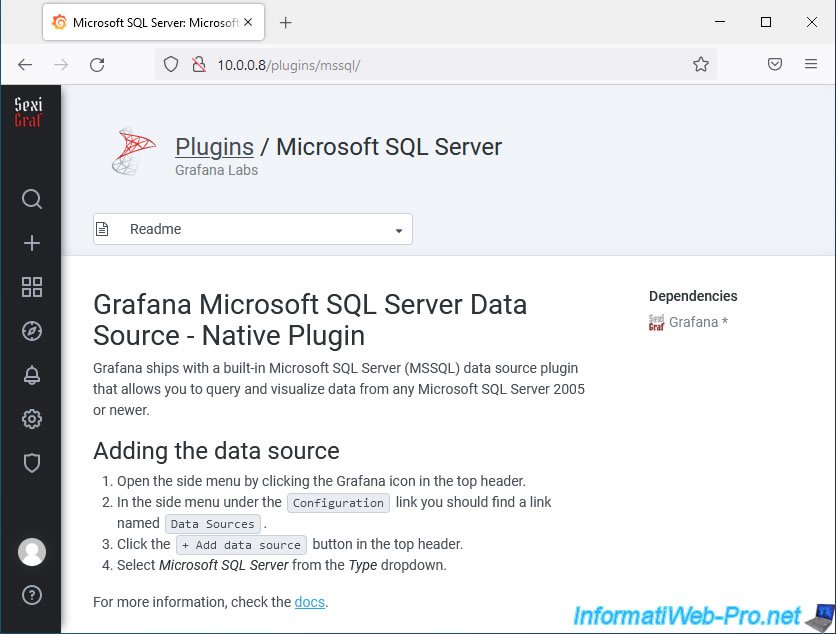
For example, you will be able to monitor well-known database servers, such as: Microsoft SQL Server, MySQL or PostgreSQL.
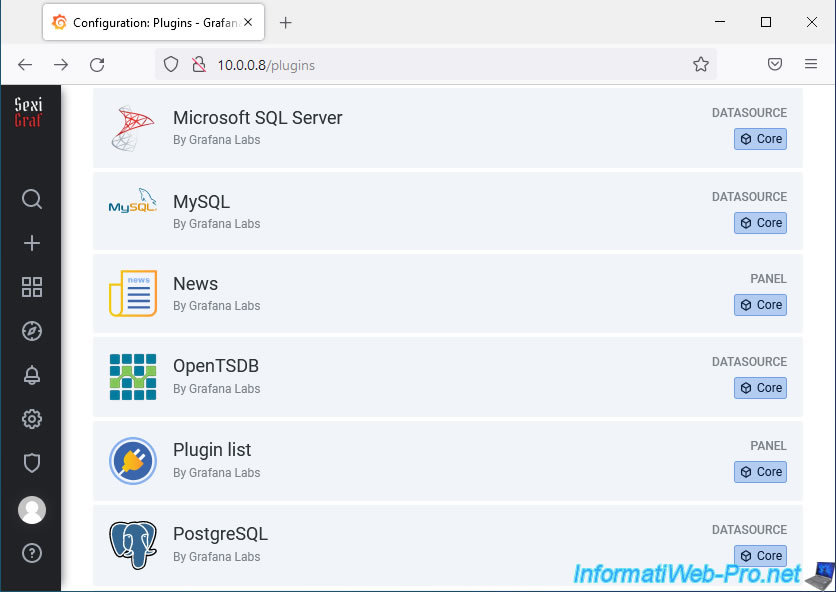
Here is an example of the "Grafana Microsoft SQL Server Data Source" plugin available on SexiGraf.
Share this tutorial
To see also
-
VMware 8/21/2024
VMware vSphere 6.7 - Add a VMkernel interface
-
VMware 8/2/2024
VMware vSphere 6.7 - Collect logs with SexiLog
-
VMware 8/9/2024
VMware vSphere 6.7 - Collect logs with VMware Aria Operations for Logs
-
VMware 1/10/2025
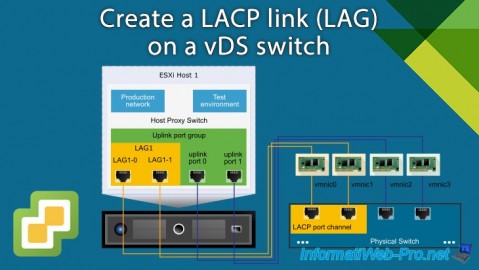
VMware vSphere 6.7 - Create a LACP link (LAG)
No comment