Deploy SexiLog on VMware vSphere 6.7 to collect logs from your ESXi hosts and VCSA
- VMware
- 02 August 2024 at 13:31 UTC
-

- 4/4
10. VCSA logs misinterpreted by SexiLog
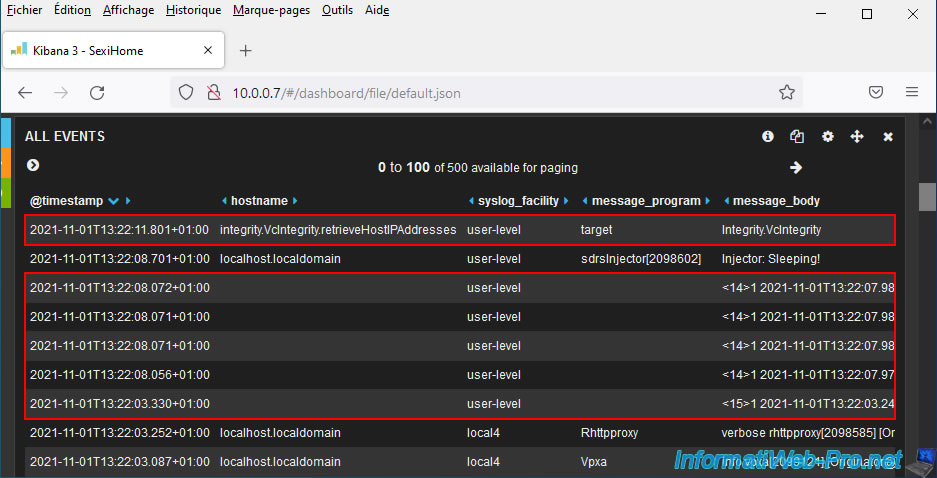
As you can see, SexiLog receives the logs from your VCSA server, but they are not correctly interpreted.
Indeed, if you look in the "hostname" column, you will see values that are not hostnames.
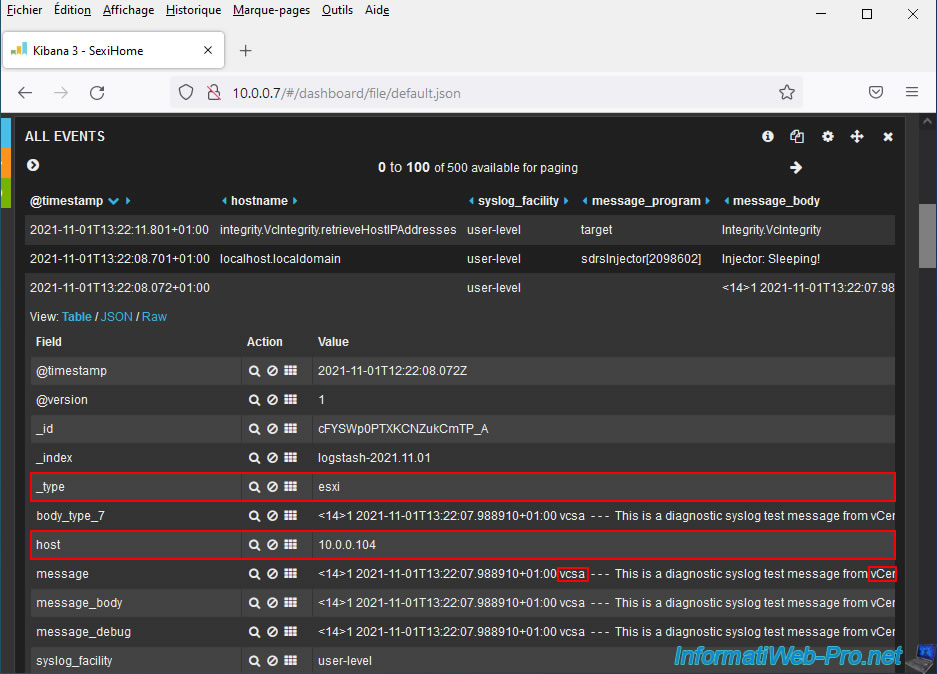
If you look at the event corresponding to the test message sent by vCenter, you will see that it is indeed this test message sent by vcsa.
The host in our case is: 10.0.0.104 (which corresponds to the IP address of our VCSA server).
The type used to interpret this event is "esxi".
Which explains why this event is not interpreted correctly.
11. Add VCSA support in SexiLog
As explained previously (in step "6.3. Restart SexiLog services" of this tutorial), SexiLog is based on several components including: logstash and elasticsearch.
Logstash takes care of parsing the data present in the logs received from your VMware ESXi host and from your VMware vCenter Server (VCSA).
Then, the data parsed by logstash is sent to Elasticsearch to be stored in fields (boxes).
To understand why the logs of your VCSA server are not interpreted correctly, you must go to the configuration of the Elasticsearch component.
To do this, go to the address “http://[IP address of SexiLog]/_plugin/head”.
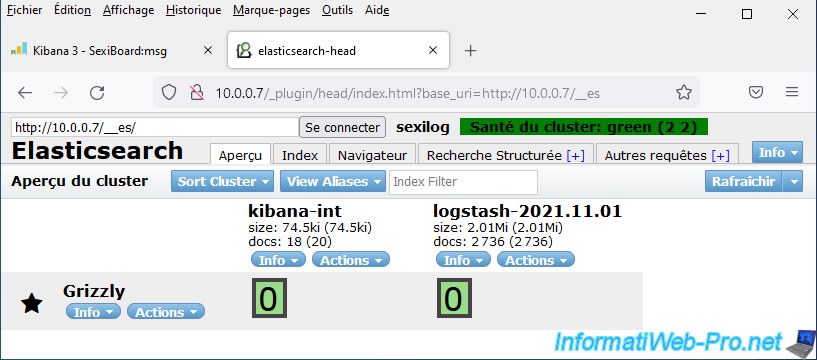
On the "Elasticsearch" page that appears, you will see:
- kibana-int: corresponds to the dashboard system (SexiBoards) on which SexiLog is based.
- logstash: corresponds to the component responsible for parsing the data from your logs.
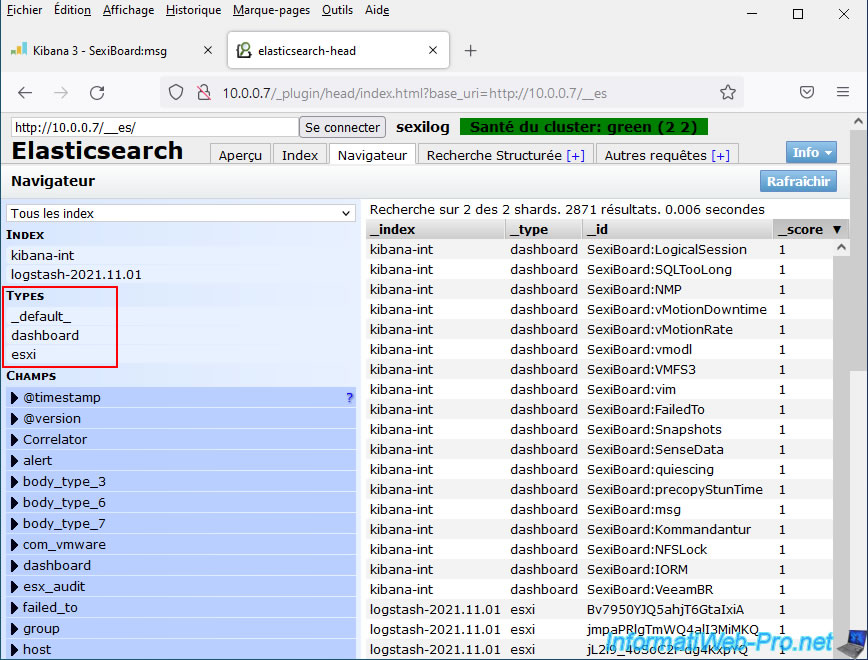
In the "Browser" tab you will see that an "esxi" type is present.
But, the type "vcsa" (for VCSA 5.x) or "vcsa6" (for VCSA 6.x) is missing.
Indeed, these types are not included by default, but are available on the official SexiLog GitHub.
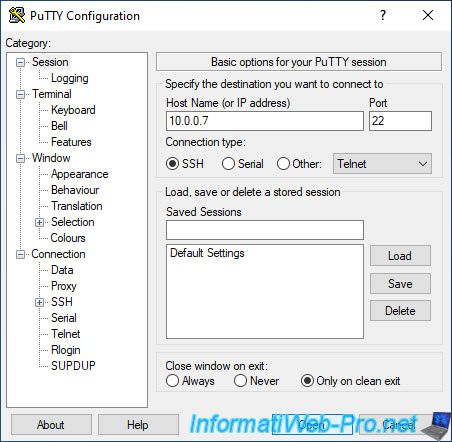
To begin, connect by SSH to your SexiLog virtual machine (via PuTTY on Windows, for example).
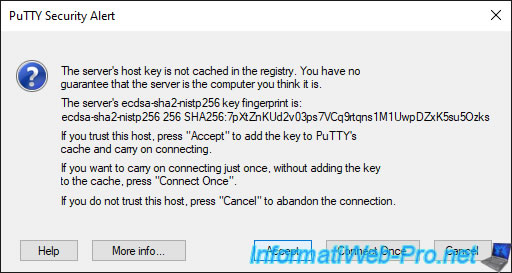
Ignore the security warning by clicking Accept, since this is the first time you are connecting to SexiLog via SSH.
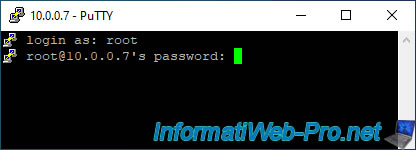
Log in as "root".
As a reminder, the default identifiers are "root / Sex!Log".
Note that the keyboard used here is yours and not the one defined for the "SexiLog" VM console.
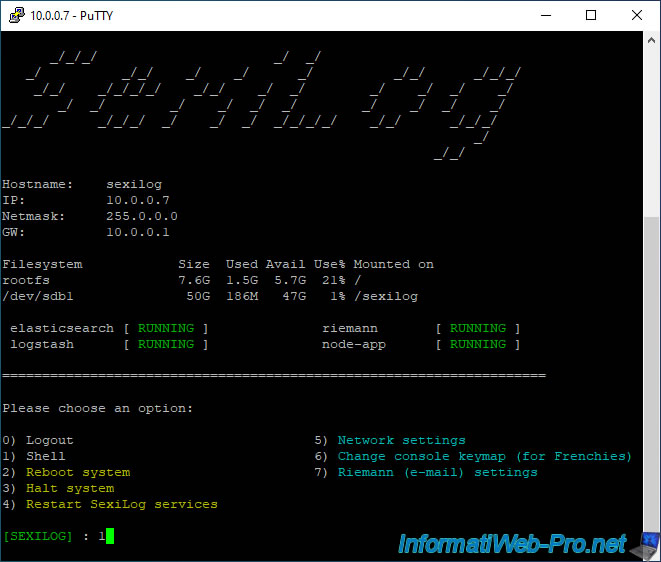
Once logged in as "root", the SexiMenu will automatically appear.
In fact, it appears automatically when you connect to the console or via SSH.
To access the Linux Shell, you will therefore have to use option 1.
Once the Shell appears, go to the "/etc/logstash/conf.d/" folder.
Bash
cd /etc/logstash/conf.d/
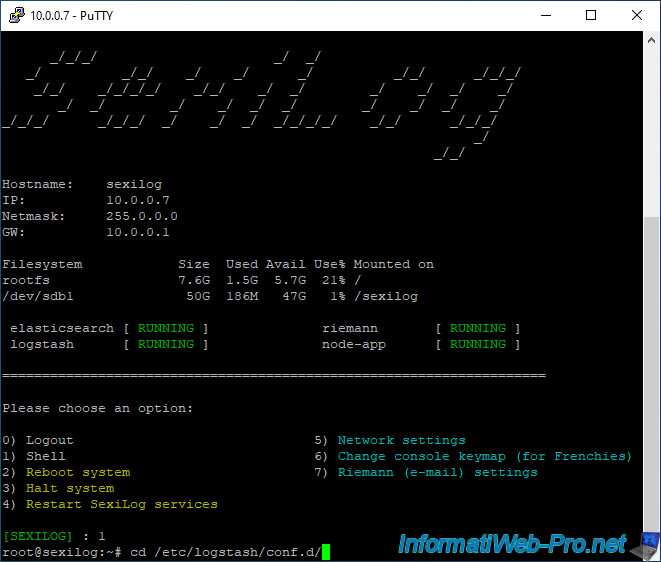
Next, list the configuration files that are located in this folder:
Bash
ls -la
As you can see, no config files for "vcsa" or "vcsa6" appear in the list.
Plain Text
total 68
drwxrwxr-x 2 root root  4096 Mar 31  2015 .
drwxrwxr-x 3 root root  4096 Mar 11  2015 ..
-rw-r--r-- 1 root root  3132 Mar 31  2015 filter-json-vcenter.conf
-rw-r--r-- 1 root root 24732 Mar 31  2015 filter-syslog-esxi.conf
-rw-r--r-- 1 root root  3648 Mar 31  2015 filter-syslog-snmp.conf
-rw-r--r-- 1 root root   120 Mar 31  2015 input-json-eventlog.conf
-rw-r--r-- 1 root root   111 Mar 31  2015 input-json-vcenter.conf
-rw-r--r-- 1 root root    54 Mar 31  2015 input-syslog-esxi.conf
-rw-r--r-- 1 root root    60 Mar 31  2015 input-syslog-snmp.conf
-rw-r--r-- 1 root root    75 Mar 31  2015 output-elasticsearch.conf
-rw-r--r-- 1 root root   793 Mar 31  2015 output-riemann.conf
So that logstash can correctly parse the data present in the logs of your VCSA 6.x server, you will need the files: filter-syslog-vcsa6.conf and input-syslog-vcsa6.conf.
For VCSA 5.x, use the old files: filter-syslog-vcsa.conf and input-syslog-vcsa.conf.
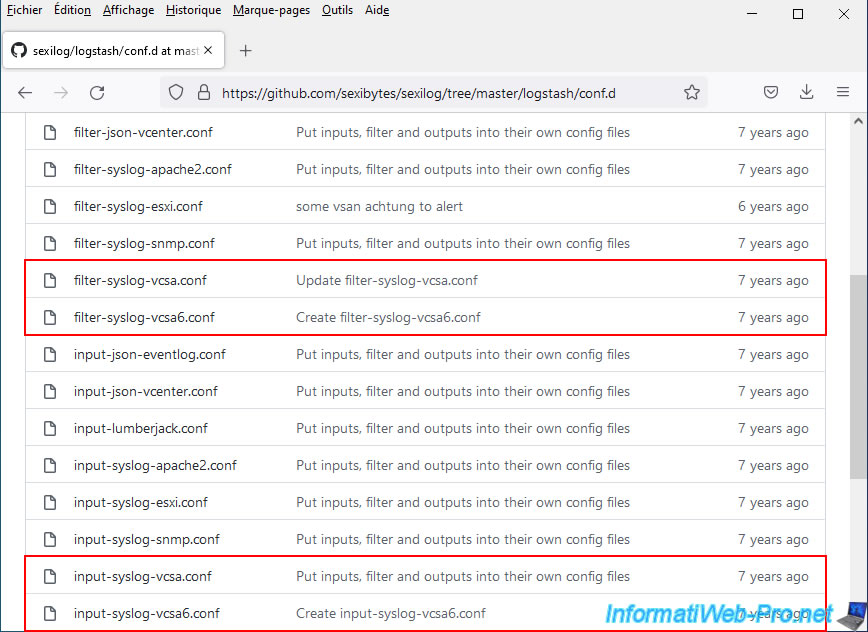
These files look like this.
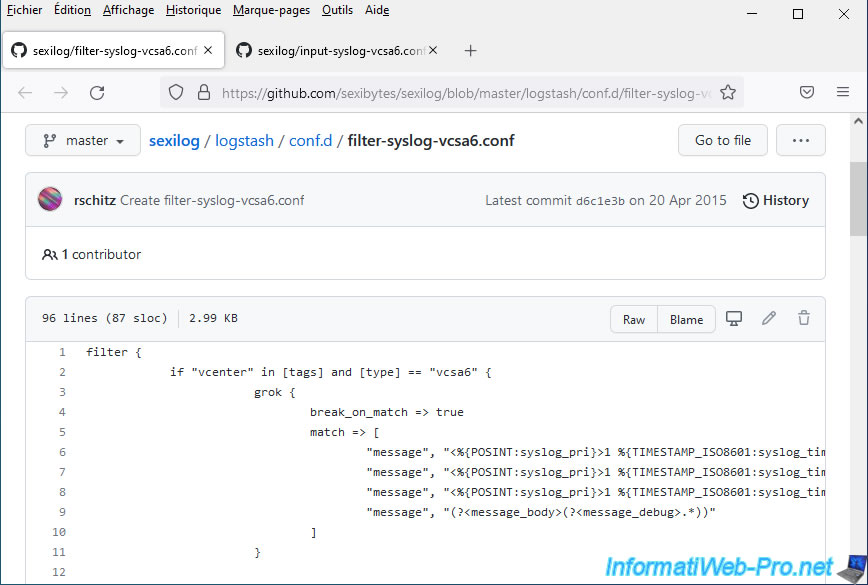
For the "input-...conf" file, it will also allow you to know which protocol and which port to use to redirect the logs from your VCSA server to SexiLog.
In this case: TCP protocol / port 1514.
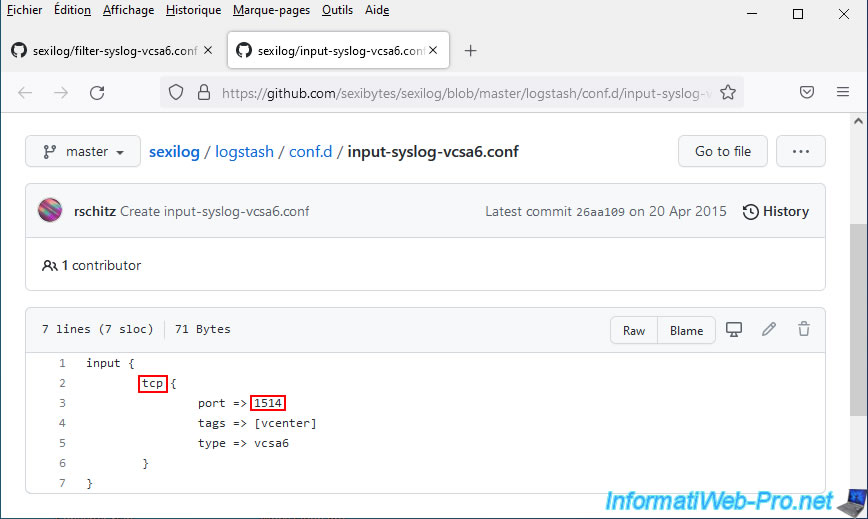
Create 2 empty files using the commands:
Bash
touch input-syslog-vcsa6.conf
touch filter-syslog-vcsa6.conf
Then :
- open the 1st file with "vim".
- press "i" once (insert mode) to be able to edit this file.
- paste the contents of the file inside.
- press "Esc" once to exit vim's insert mode and return to command mode.
- type ":wq" (without quotes) to exit, saving the changes and validate by pressing Enter.
Bash
vim input-syslog-vcsa6.conf
Do the same with the other file.
Bash
vim filter-syslog-vcsa6.conf
Now that the necessary configuration files have been added, return to the SexiMenu by typing:
Bash
/root/seximenu/seximenu.sh
Then use option: 4 (Restart SexiLog services).

As expected, restarting the SexiLog services will also restart the "logstash" (whose configuration files we have just modified) and "elasticsearch" (which receives the data sent by logstash) components.
Type "y" and press Enter.

SexiLog services have been restarted.
Press Enter.
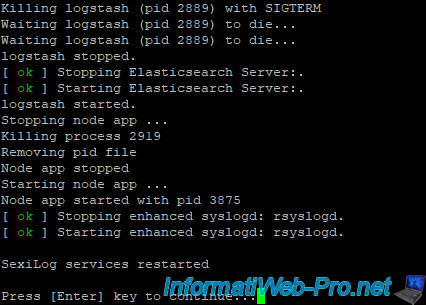
Use the "0 (Logout)" option to log out and close this SSH session.

If you return to the Elasticsearch configuration (using the address "http://[IP address of SexiLog]/_plugin/head"), you will see that a new type "vcsa6" (for VCSA 6.x) or "vcsa" (for VCSA 5.x) appeared in the "Browser" tab.
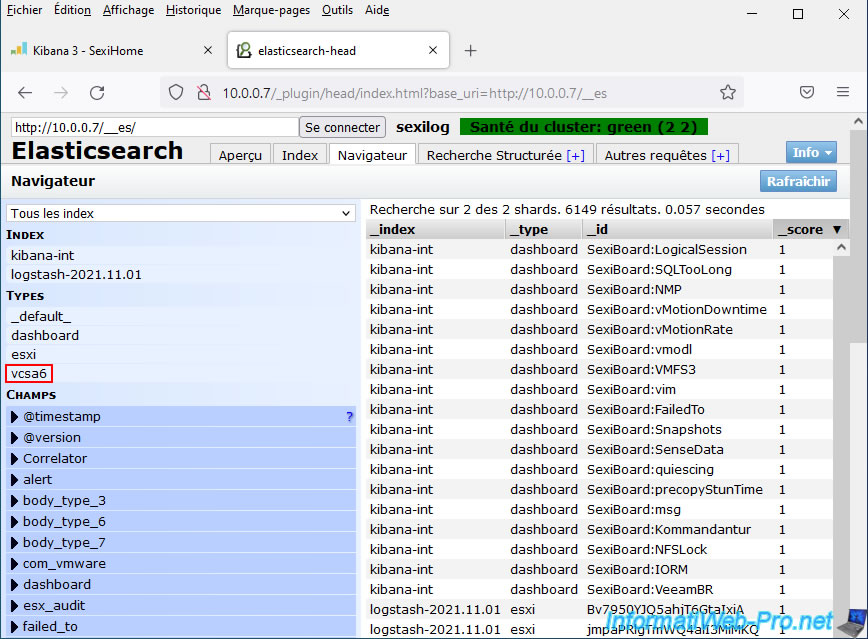
12. Overview of VMware vCenter Server (VCSA) logs in SexiLog
As you can see, events from your VMware vCenter Server (VCSA) logs are now correctly interpreted.
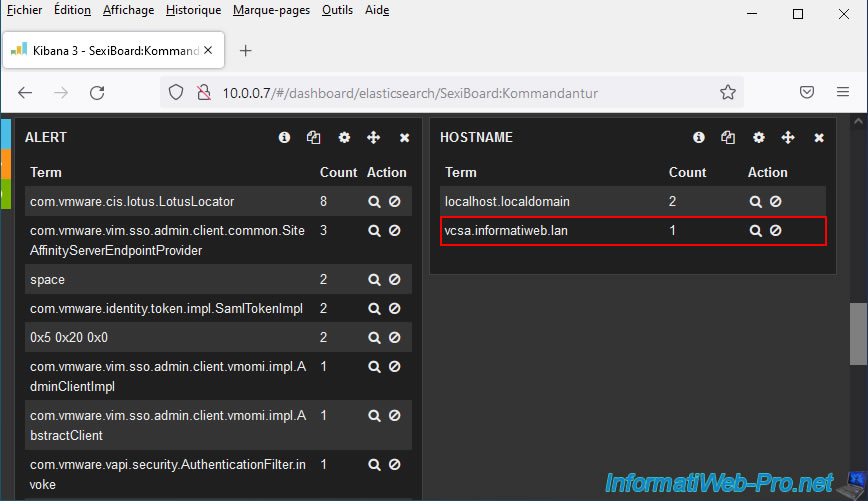
In our case, we see our host "vcsa" appear in the "hostname" column for events coming from our server "VMware vCenter Server (VCSA)".
The "localhost.localdomain" host for other events is the default hostname for VMware ESXi hypervisors.
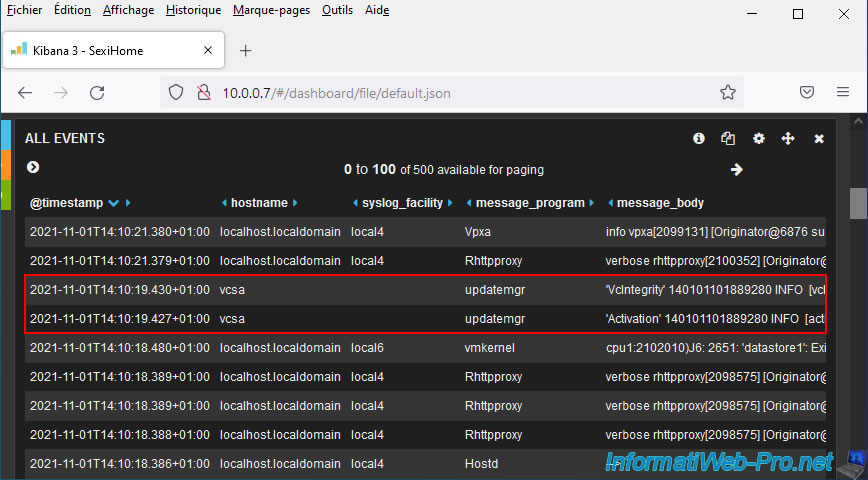
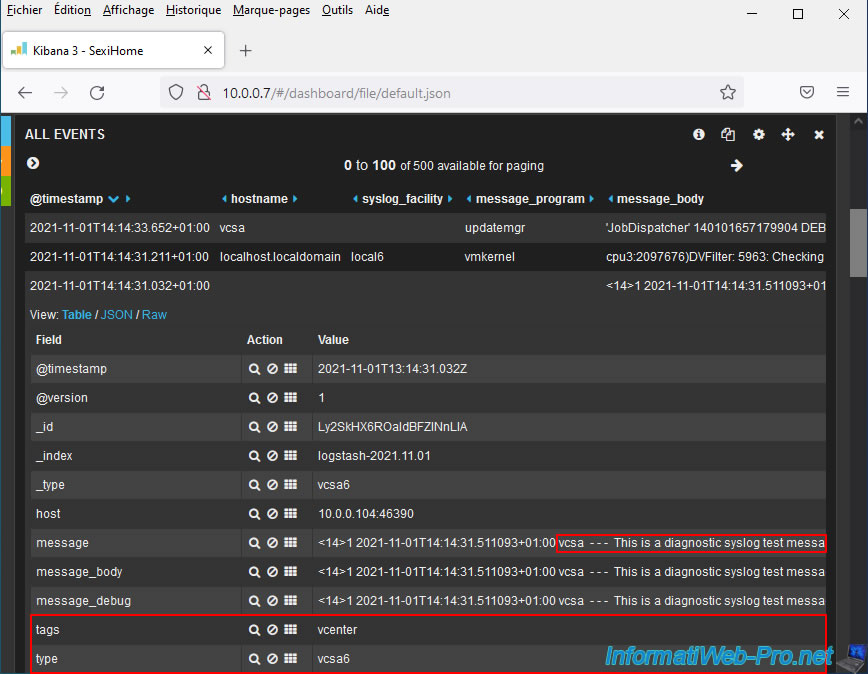
If you deploy an event from your VMware vCenter Server (VCSA), you will find this information, among other things:
- _index: contains the keyword "logstash" (used to parse log data sent by your VMware vCenter Server (VCSA).
- hostname: the host name of your VMware vCenter Server (VCSA). In our case: vcsa.
- tags: the keyword "vcenter". Used to identify logs coming from a VMware vCenter Server (VCSA).
- type: indicates the configuration used to parse this data.
As expected, the type used is now "vcsa6" (or "vcsa") instead of "esxi".
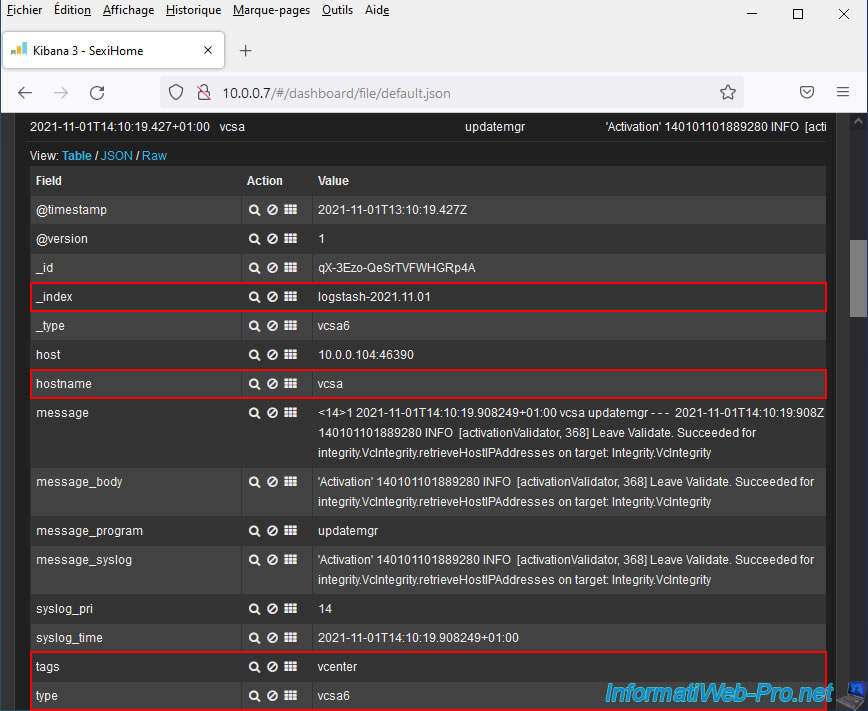
If you look in the different dashboards (and in particular the "Kommandantur" dashboard), you will see that many additional alerts and/or events have appeared.
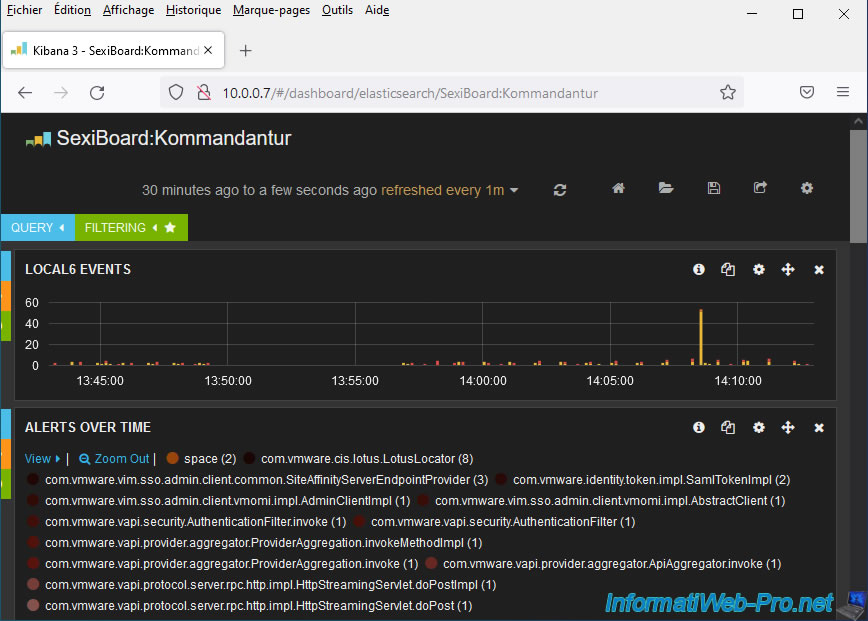
For the "Kommandantur" dashboard, you will see that a new host (vcsa.informatiweb.lan in our case) has appeared in the "hostname" list (under the graph).
If you return to the SexiLog home page (via the house icon at the top right of the page), you may be able to find the test message previously sent from your VMware vCenter Server (VCSA).
If you view the details of this event, you will see that it contains the tag "vcenter" and that the type used is now "vcsa6".
Which confirms that the logstash is now configured correctly.
Share this tutorial
To see also
-
VMware 8/21/2024
VMware vSphere 6.7 - Add a VMkernel interface
-
VMware 8/9/2024
VMware vSphere 6.7 - Collect logs with VMware Aria Operations for Logs
-
VMware 1/10/2025
VMware vSphere 6.7 - Create a LACP link (LAG)
-
VMware 1/24/2025
VMware vSphere 6.7 - Create a network protocol profile

No comment