Deploy SexiLog on VMware vSphere 6.7 to collect logs from your ESXi hosts and VCSA
- VMware
- 02 August 2024 at 13:31 UTC
-

- 3/4

7. Redirect VMware ESXi logs
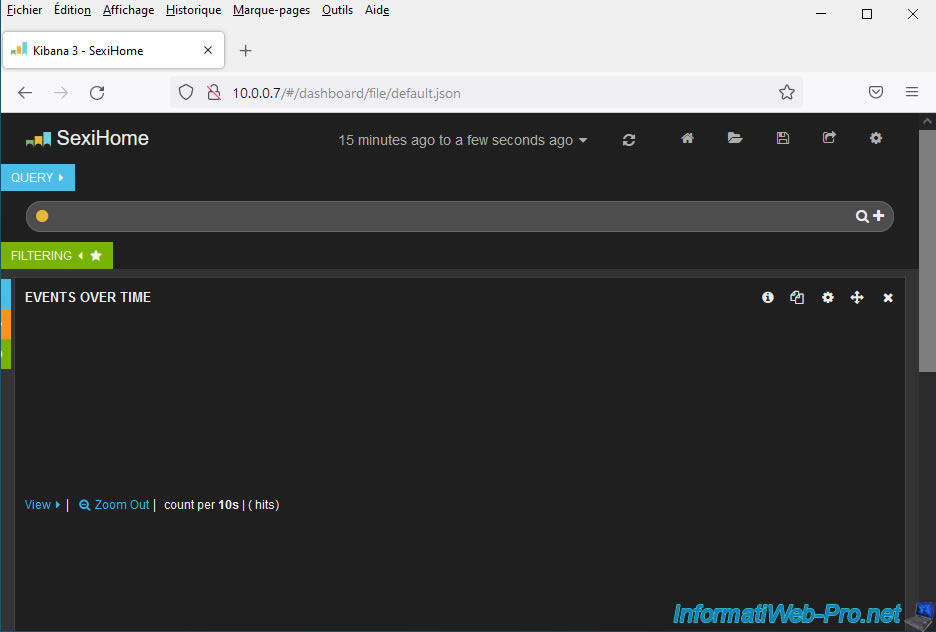
If you access SexiLog's web interface by simply typing its IP address into your web browser's address bar, you will see a SexiHome page.
However, you will not see any graphs or events at this time as no logs are currently sent to this SexiLog server.
To redirect logs from your VMware ESXi host to SexiLog, access the web interface of your VMware ESXi host and go to: Host -> Manage -> System -> Advanced settings.
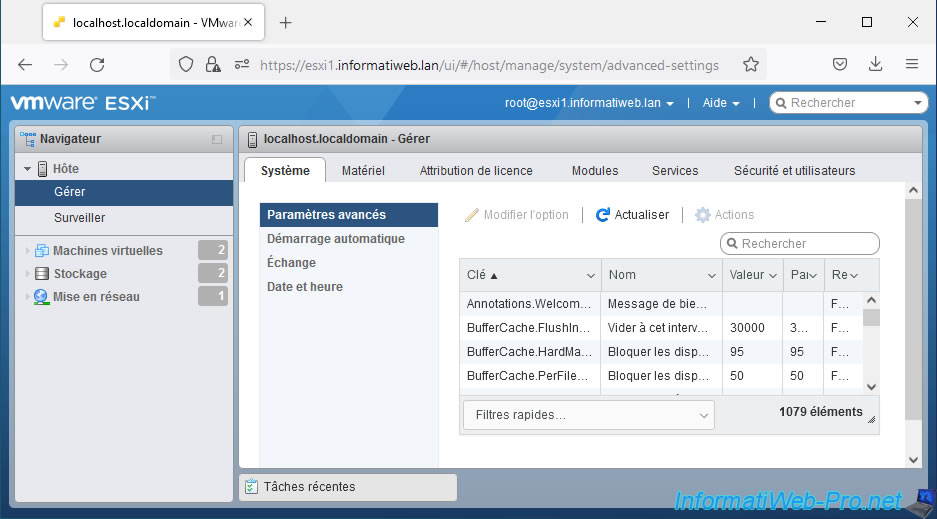
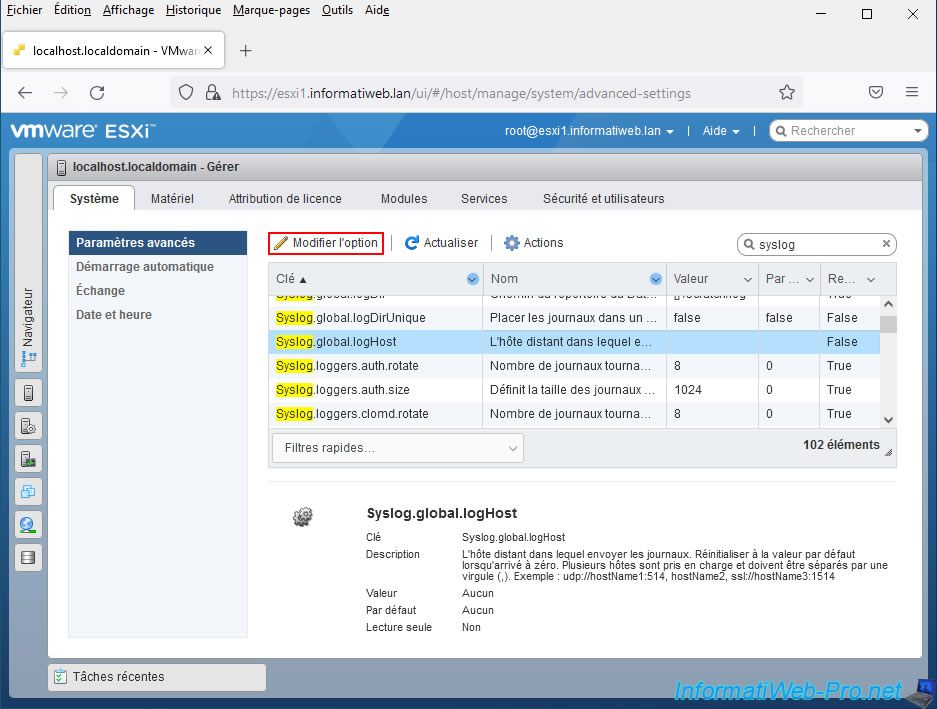
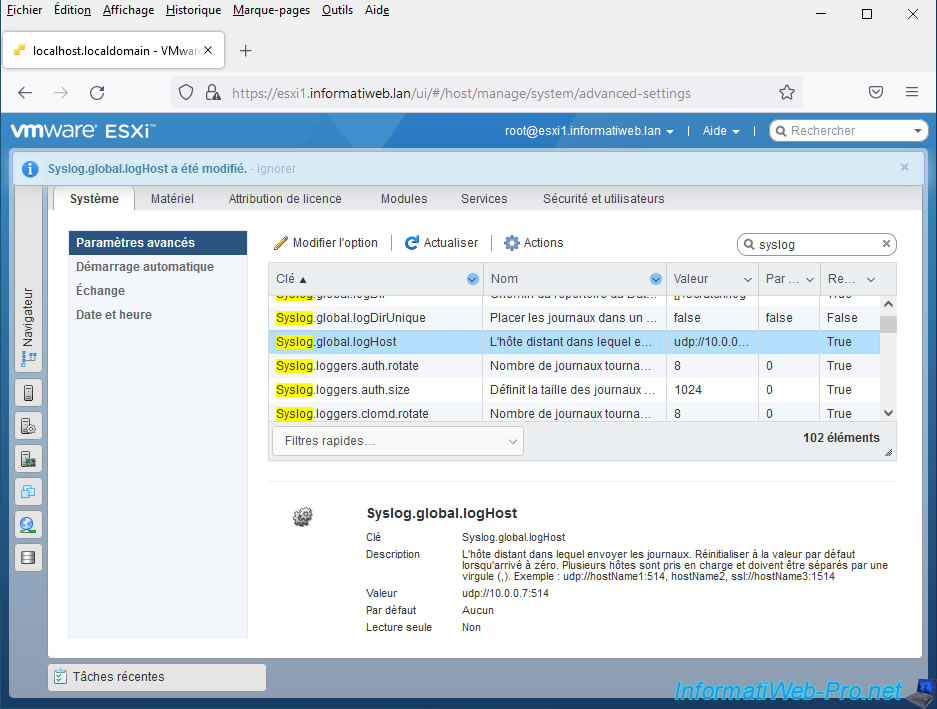
Type "syslog" in the search box at the top right of the table and press Enter.
Next, select the advanced setting “Syslog.global.logHost” and click: Edit option.
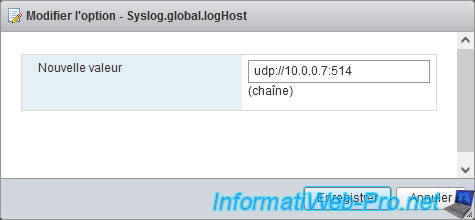
In the "New value" box, specify: udp://[ip address of the SexiLog VM]:514.
Which gives in our case: udp://10.0.0.7:514
The Syslog.global.logHost advanced setting has been changed.
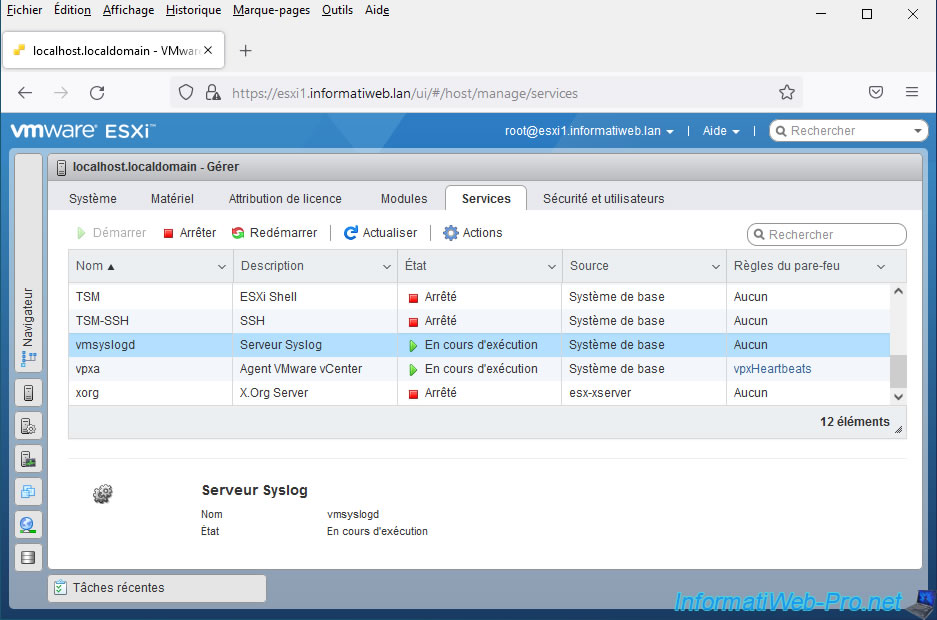
In the "Host -> Manage -> Services" menu, verify that the "vmsyslogd" service (Syslog Server) is running.
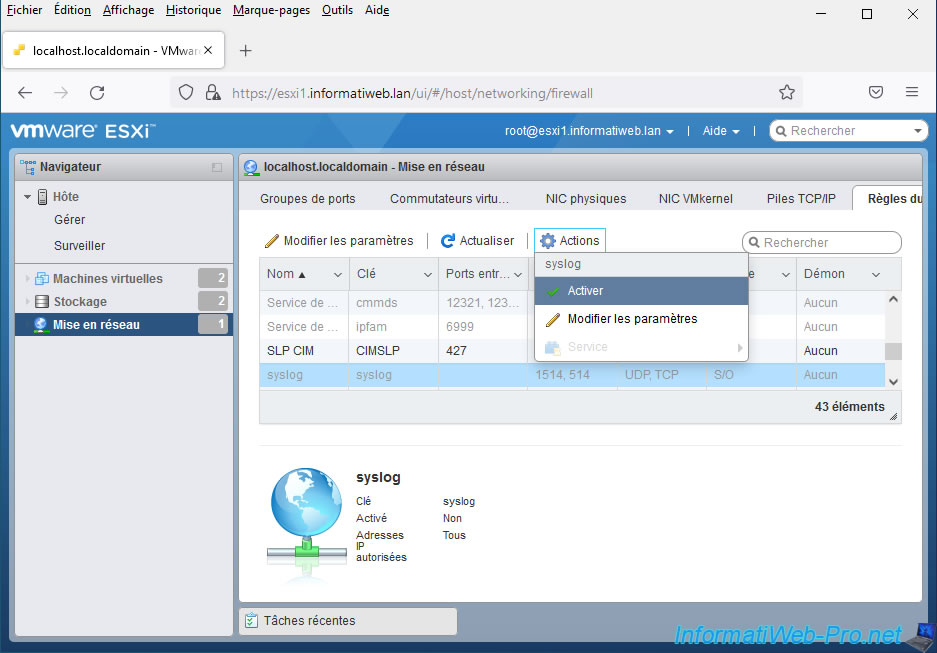
Now that VMware ESXi is configured to forward logs to a remote syslog server, you need to open the corresponding ports in your VMware ESXi server's firewall.
To do this, go to "Networking -> Firewall Rules", then select the "syslog" rule and click: Actions -> Enable.
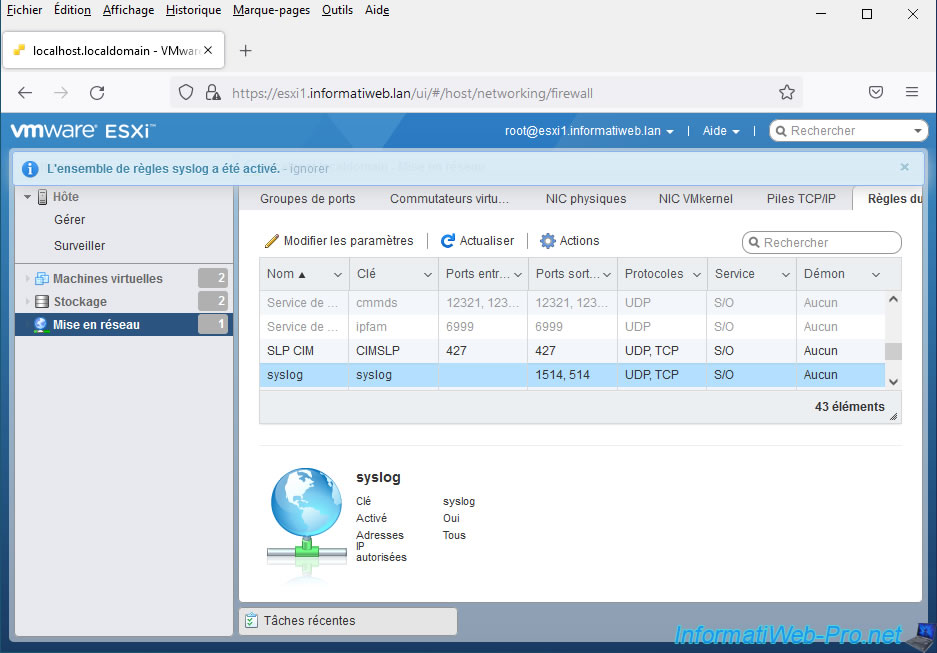
The "syslog ruleset was successfuly enabled" message appears.
8. Overview of VMware ESXi logs in SexiLog
If you access the SexiLog web interface, you will see that data is now present.
At the top, you can select the period for which you wish to consult the logs.
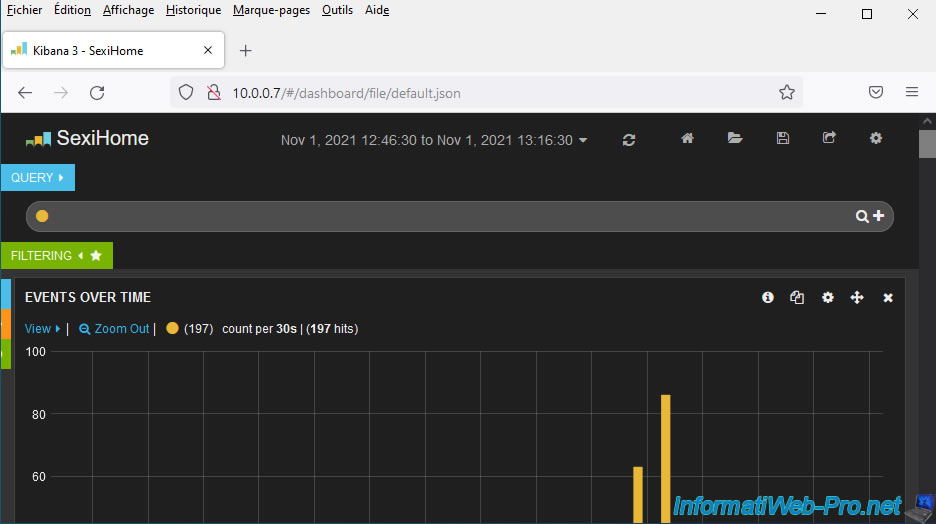
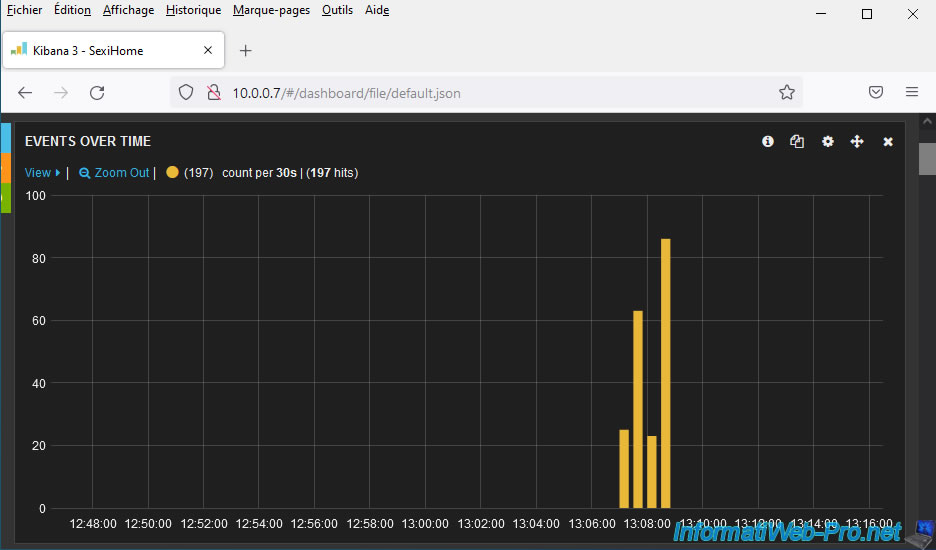
On the home page, you will first see an "Events over time" graph showing the number of events that have occurred.
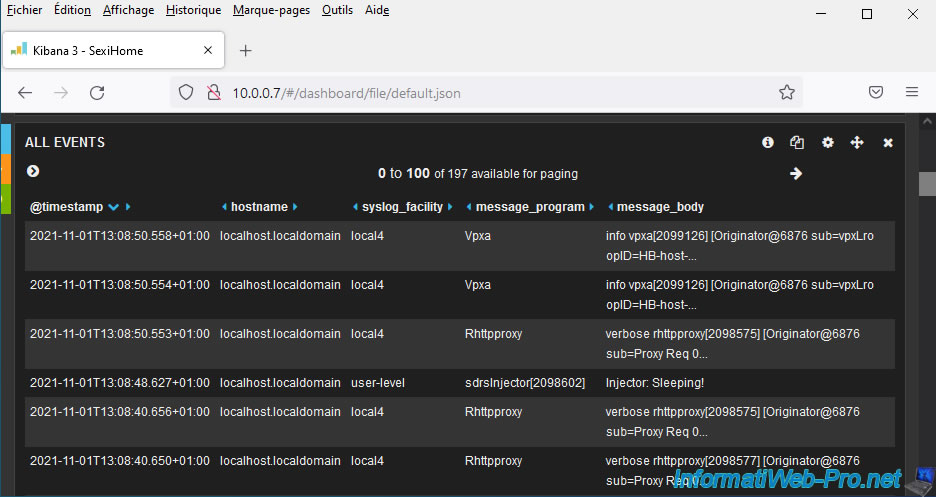
Below this graph, you will find the list of these events (All events).
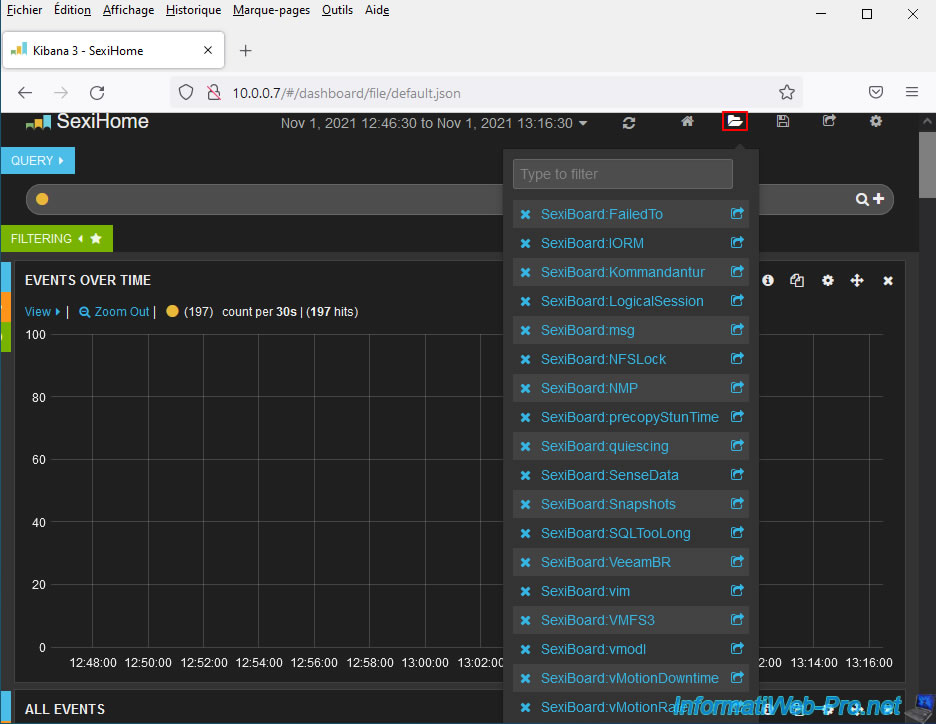
By clicking on the icon representing a folder displayed at the top of the page, you can access different dashboards (SexiBoards):
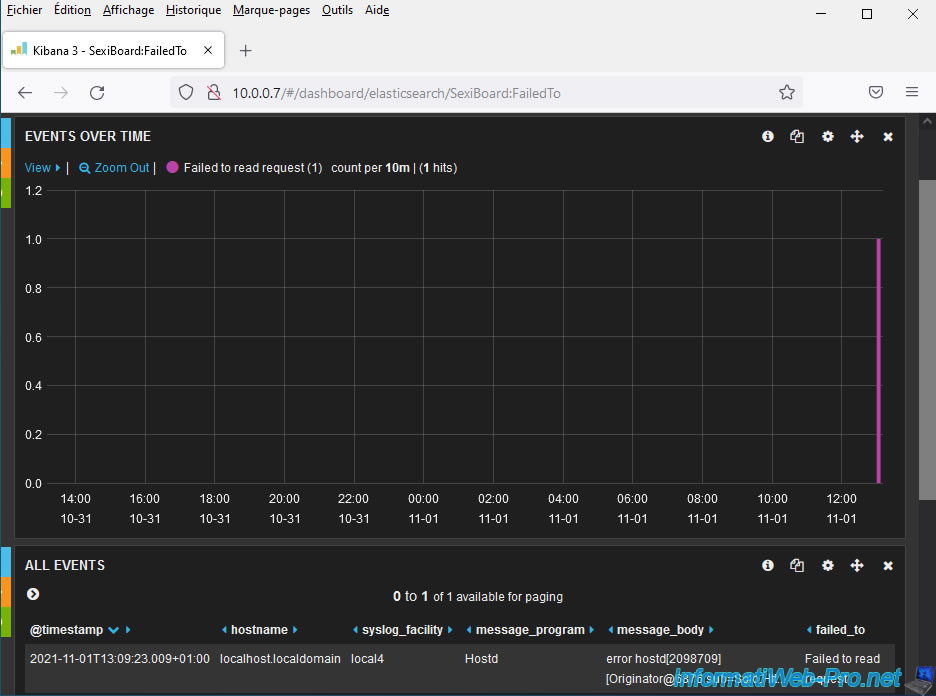
- SexiBoard.FailedTo: allows you to detect and list the various "failed to..." errors that may have occurred on your server.
- SexiBoard.IORM: allows you to monitor inputs/outputs at the storage level (data banks) and thus detect any latency that may occur on your server.
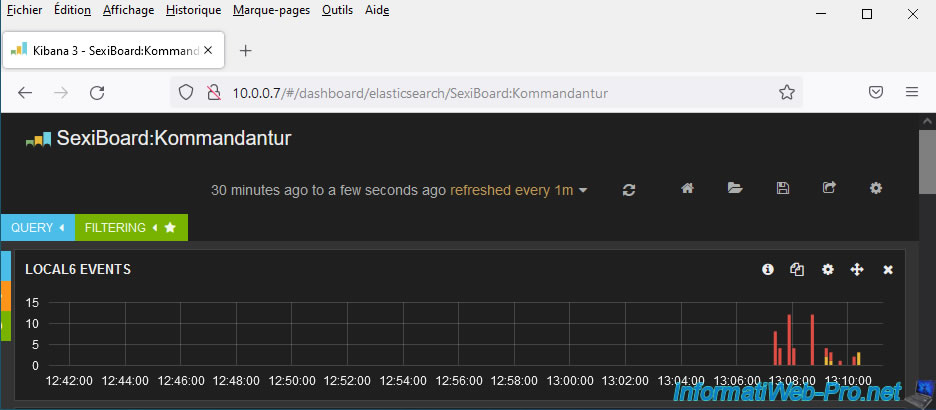
- SexiBoard.Kommandantur: allows you to quickly see when something starts to no longer work correctly.
- SexiBoard.LogicalSession: this dashboard uses statistics counters from the “vpxd-filter.log” file.
- SexiBoard.msg: centralizes messages referenced as "msg.xxxxxx".
- SexiBoard.NFSLock: lists all NFSLock problems, such as: Not Found, Busy, ...
- SexiBoard.NMP: concerns the NMP (Native Multipathing) component which is a module managing sub-plugins.
- SexiBoard.precopyStunTime: allows you to see the pre-copy stun time of vMotion (migration of VMs and/or its storage).
- SexiBoard.quiescing: allows you to view errors that may occur during virtual machine backup / snapshot creation.
- SexiBoard.SenseData: lists the errors that have occurred on your SCSI network (Fiber Channel, FCoE, iSCSI, etc.).
- SexiBoard.Snapshots: allows you to see the snapshot creation and deletion history. This happens in particular when you back up virtual machines.
- SexiBoard.SQLToolLong: allows you to see if latency has been detected in the SQL execution time of your queries.
- SexiBoard.VeeamBR: allows you to process SNMP traps sent from a Veeam Backup console.
- SexiBoard.vim: VIM stands for Virtual Infrastructure Methodology (the RESTful API of VMware vSphere).
Data is added to this "vim" dashboard every time logstash sees something like "vim.method.call". - SexiBoard.VMFS3: Helps detect high VMFS3 reservation time issues.
This happens when a SCSI reserve/release operation takes longer than expected (max 200ms). - SexiBoard.vmodl: VMODL stands for VMware Managed Object Design Language and lists messages detected when logstash sees something like "vmodl.fault.object".
- SexiBoard.vMotionDowntime: allows you to view the inaccessibility time of virtual machines (VMs) moved from one VMware ESXi host to another via vMotion.
- SexiBoard.vMotionRate: allows you to check whether a migration is taking place at full speed or not.
For more information regarding SexiLog's dashboards (SexiBoards), refer to the "SexiBoards - SexiLog" page of the official website.
Here are some small examples below, but you will find more on the “SexiBoards” page mentioned above.
If you select the "SexiBoard.FailedTo" dashboard, you will see that SexiLog will display all "Failed to..." type events.
As explained previously, the “Kommandantur” dashboard allows you to see what is starting to no longer work.
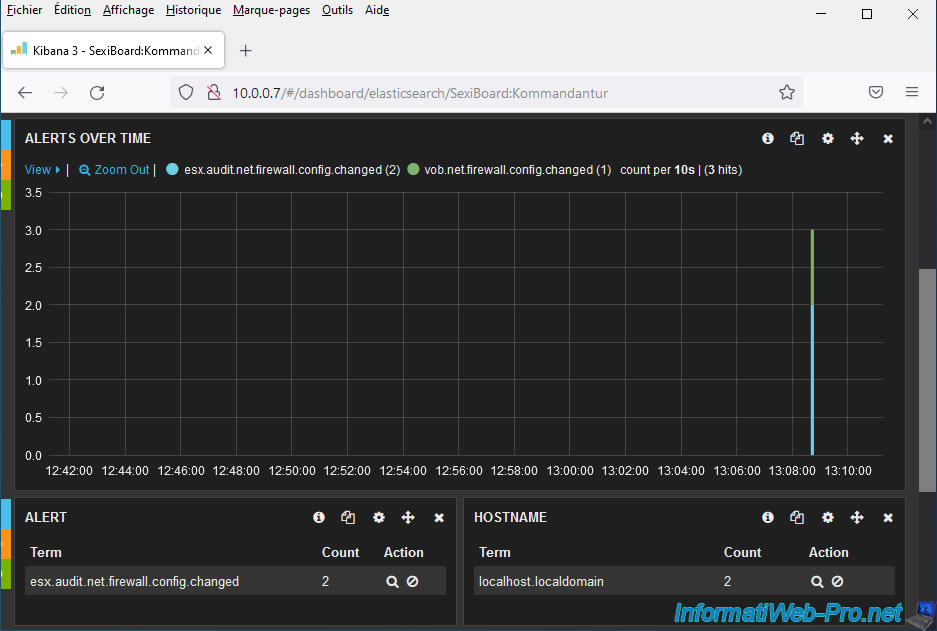
In our case, we can therefore see that the firewall configuration has been changed several times. This could pose a security problem if this was not intended.
In our case, this is the activation of the "syslog" rule in the firewall of our VMware ESXi host which allows us to authorize the transfer of logs to a remote server (SexiLog in this case).
9. Redirect VMware vCenter Server (VCSA) logs
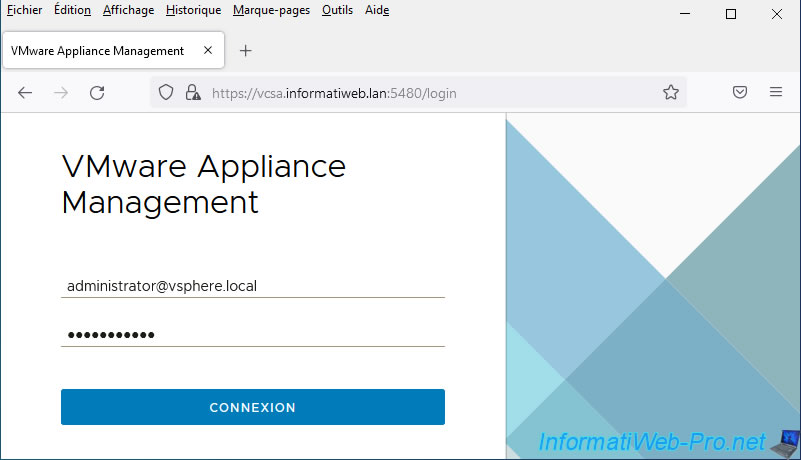
To redirect VMware vCenter Server (VCSA) logs to SexiLog, connect to port 5480 of your VCSA server as "administrator@vsphere.local" or "root".
Note that the login page is named "VMware Appliance Management" in this case.
Once logged in to the “Appliance Management” page, go to the “Syslog” section and click on the “Configure” link.
![]()
To transfer logs from your VCSA server to SexiLog, specify:
- Server Address: SexiLog IP address.
- Protocol: TCP
- Port: 1514
Then click Save.
![]()
The remote syslog host appears in the list and its connection status is "Accessible" if the remote SexiLog server is turned on and reachable.
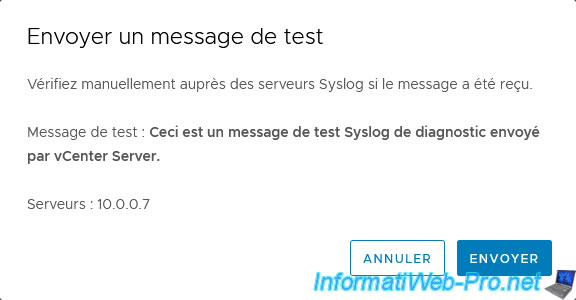
Note that VCSA allows you to send a test message to your syslog servers to test whether SexiLog is receiving your logs.
![]()
Click Send.
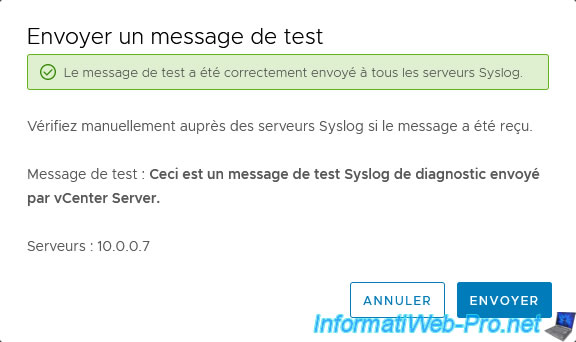
The message "Successfully sent the test message to all syslog servers." appears.
Click "Cancel" to close this window.
Share this tutorial
To see also
-
VMware 8/21/2024
VMware vSphere 6.7 - Add a VMkernel interface
-
VMware 8/9/2024
VMware vSphere 6.7 - Collect logs with VMware Aria Operations for Logs
-
VMware 1/10/2025
VMware vSphere 6.7 - Create a LACP link (LAG)
-
VMware 1/24/2025
VMware vSphere 6.7 - Create a network protocol profile
No comment