- VMware
- 31 March 2023 at 11:24 UTC
-

- 1/2

Using the VMware ESXi web client (HTML5), you can monitor host and guest processor (CPU) utilization and other host CPU information.
This will allow you to diagnose the performance problems of your virtual machines by identifying important data.
- Monitor CPU usage
- Monitor processor (CPU) Ready state
- Monitor processor (CPU) CO-STOP state
- NUMA alignment
1. Monitor CPU usage
1.1. Host processor (pCPU) usage by host
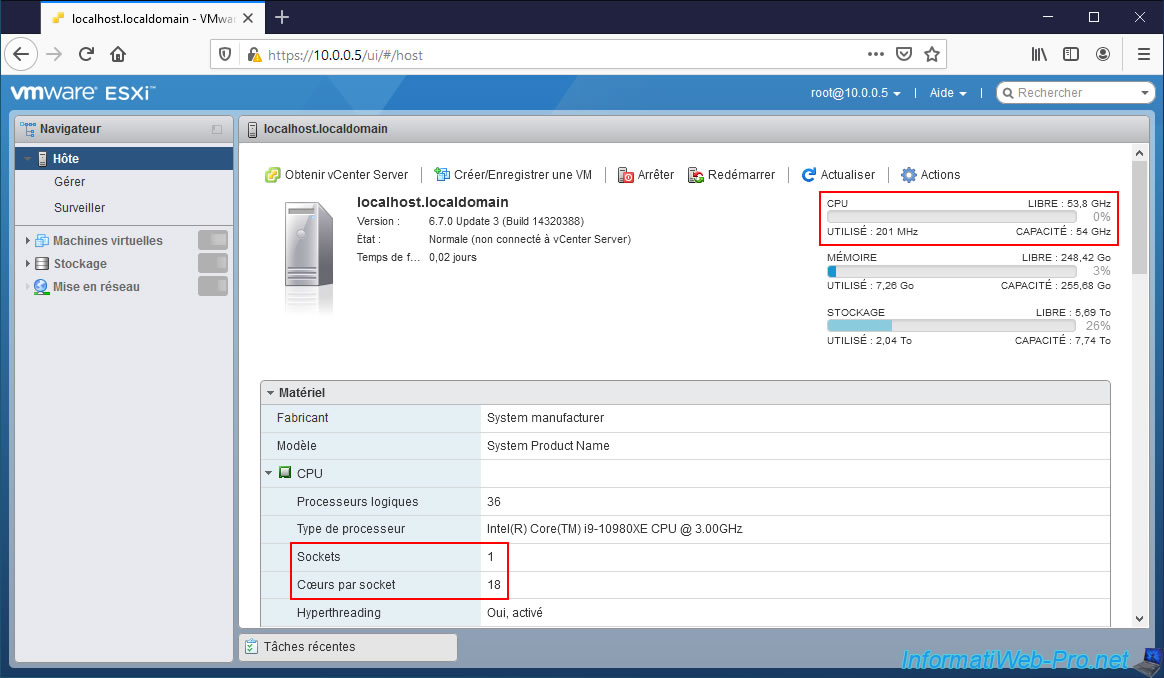
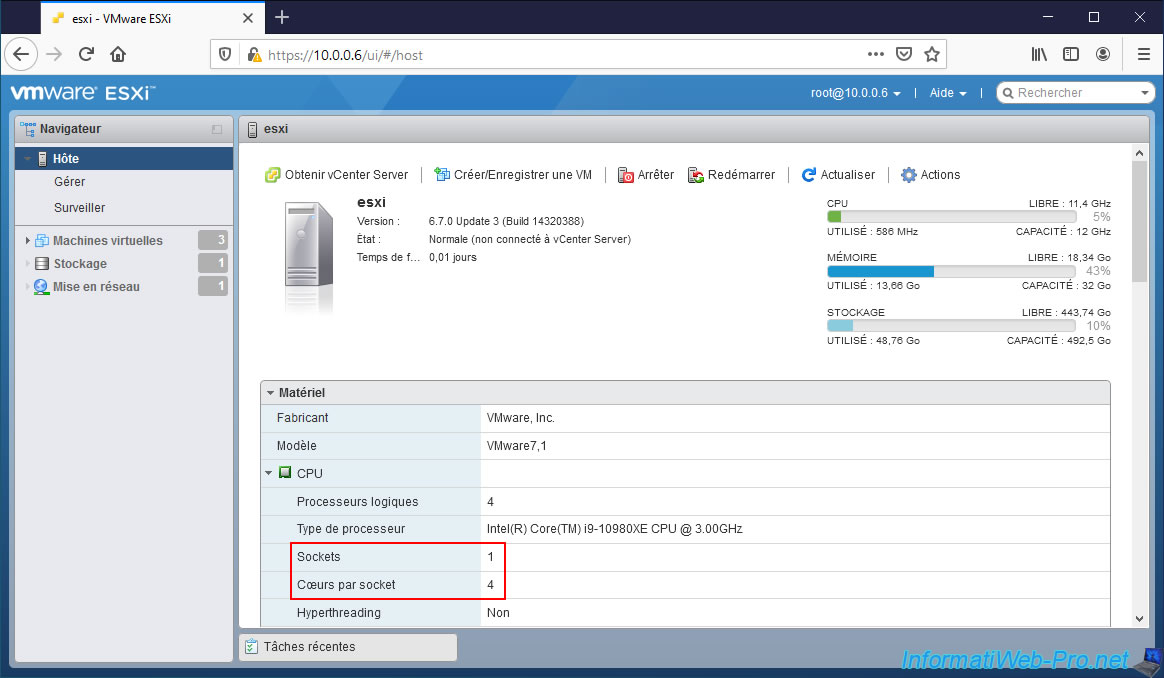
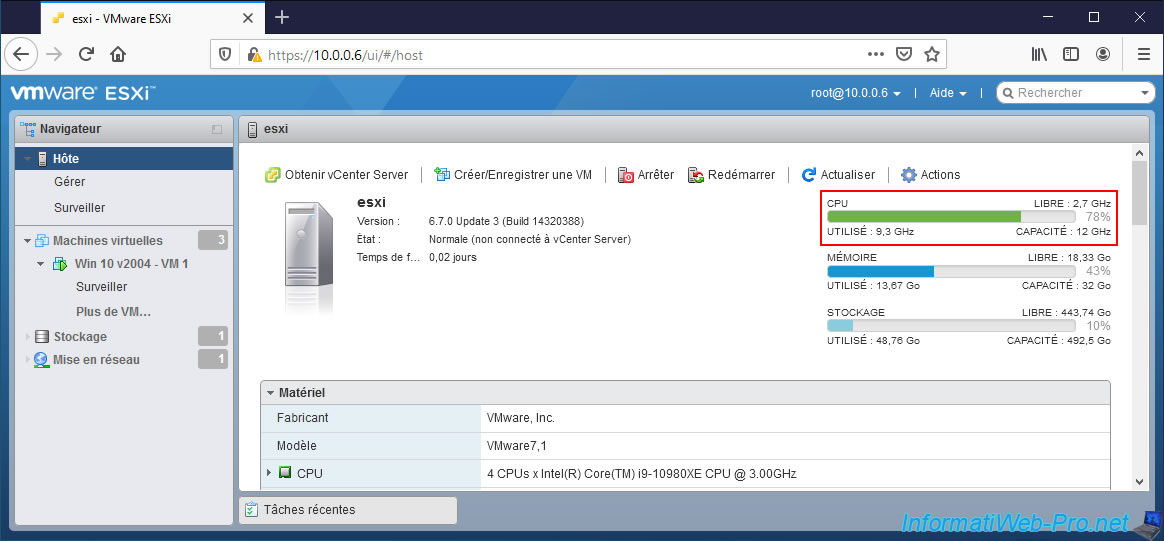
To begin, on the home page (accessible via the "Host" menu on the left), you can monitor CPU usage via the information displayed at the top right.
You can see the frequency used (in MHz/GHz or in %), its total capacity (in MHz/GHz) and what is available (in MHz/GHz).
Note that the usage appears in green (only if the processor is minimally used).
Note that the capacity in GHz displayed by VMware ESXi corresponds to the base frequency of your processor (in our case : 3 GHz) multiplied by the number of physical cores of your processor.
Which gives in our case : 3 GHz x 18 = 54 GHz.
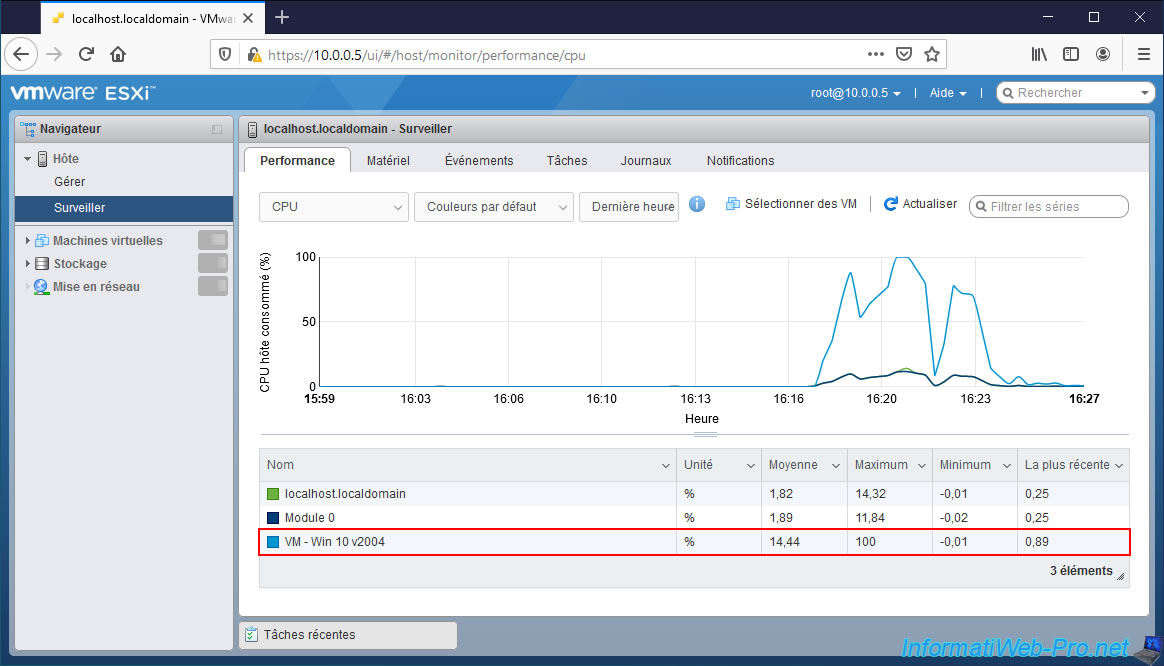
If you go to the "Host -> Monitor" menu, you will see the graph regarding the processor (CPU) by default.
As you can see, this graph allows you to monitor :
- [Name of your ESXi host] : the overall utilization of all CPUs on your server (in case you have more than one).
- Module X : the use of each physical processor (socket) of your server
Note that VMware ESXi can only display usage history for the last hour.
To have a longer history, you will need VMware vCenter Server (VCSA).
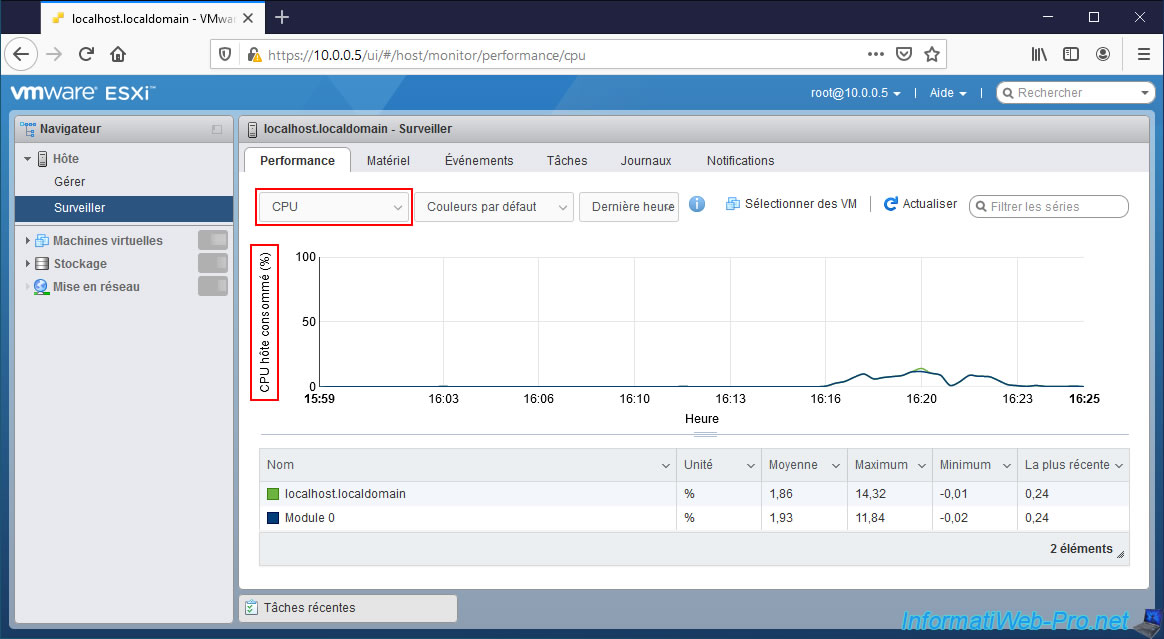
Optionally, you can click the "Select VMs" option to add powered on virtual machines into this graph.
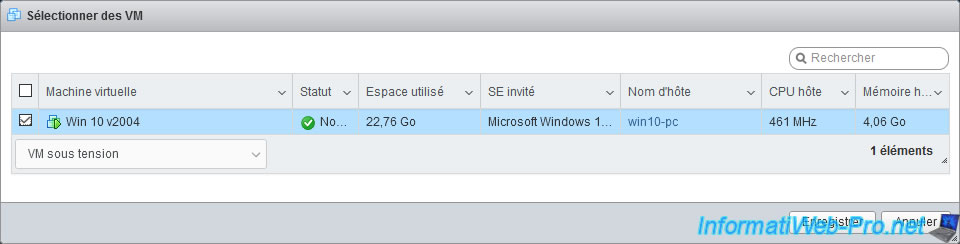
Thus, you can monitor the CPU usage by the host, as well as by the desired VMs via a single graph.
1.2. Host processor (pCPU) usage by a virtual machine (VM)
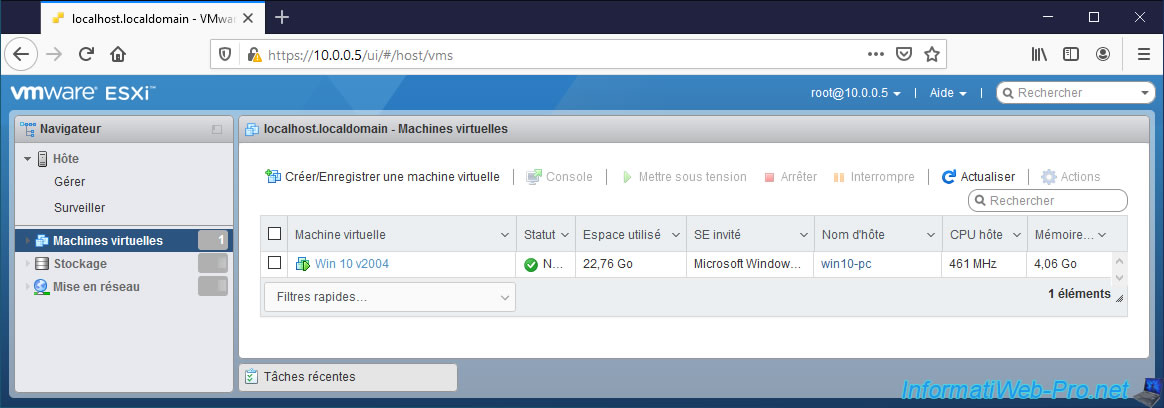
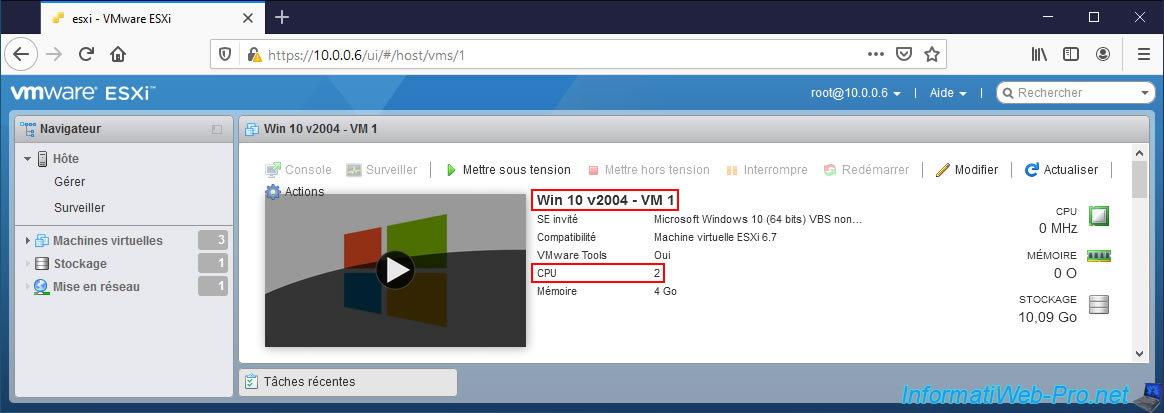
If you go to the "Virtual Machines" menu, you can quickly see the CPU usage (in MHz/GHz) of each virtual machine in the "Host CPU" column.
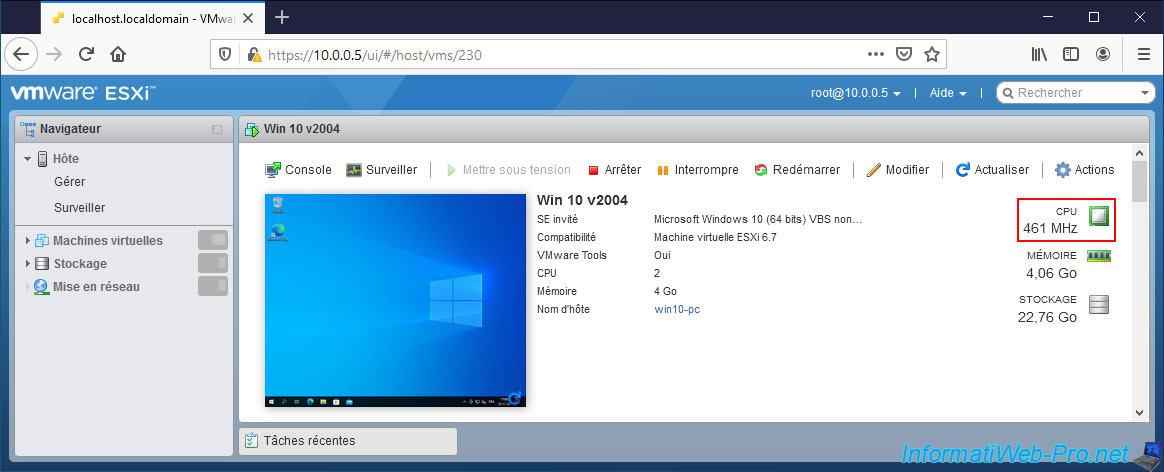
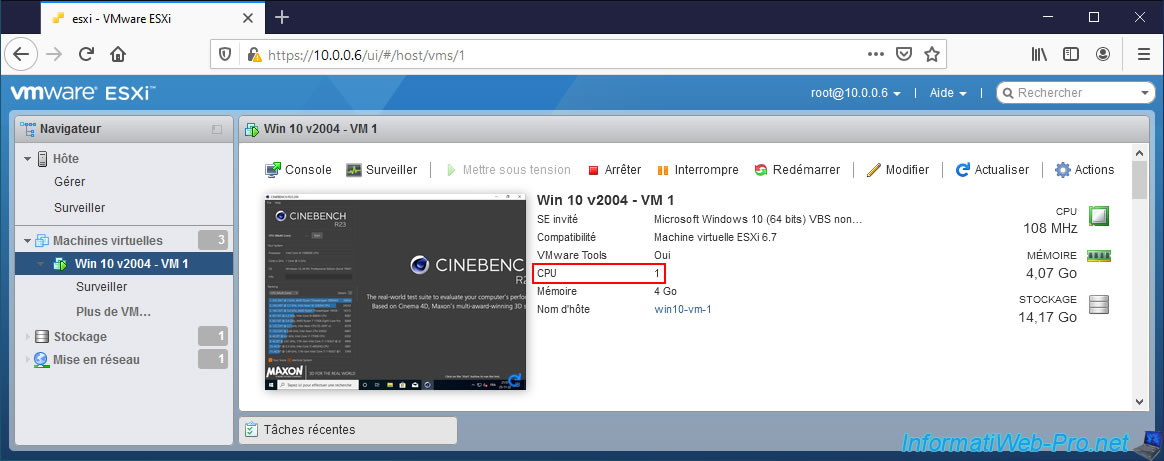
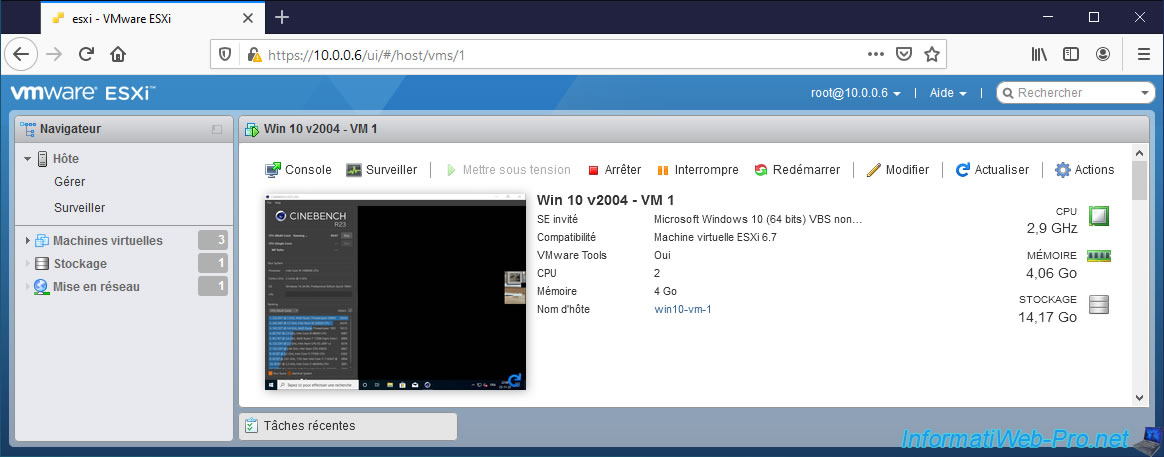
If you click on the name of a virtual machine, you will be able to see the real-time CPU usage (in MHz/GHz) by it.
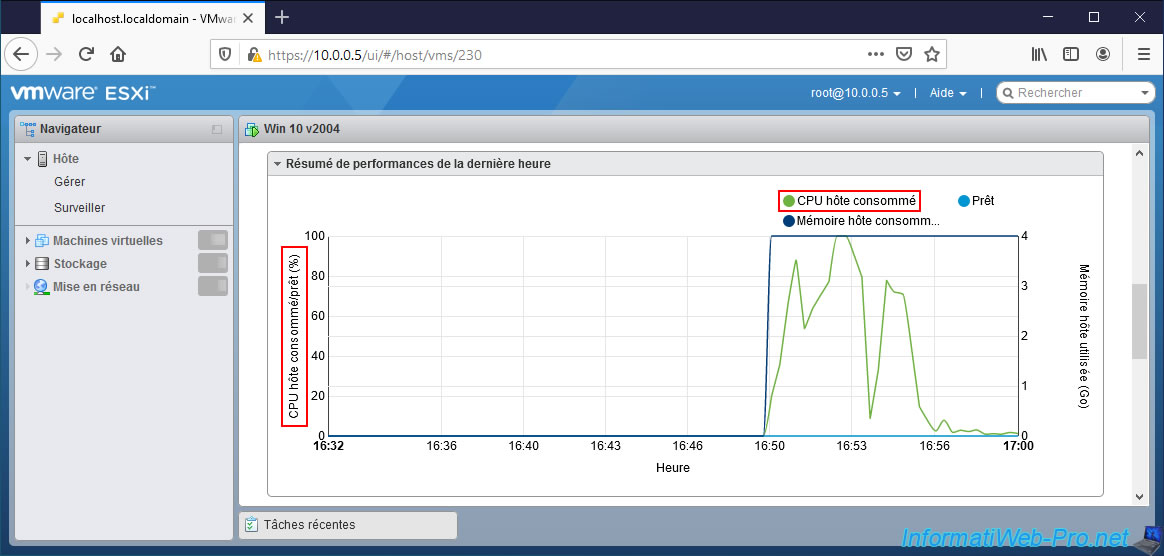
Further down, you will find a "Performance summary last hour" graph where you can monitor the host CPU usage (in green) for the last hour.
The axis you need to look at is the one on the left : Consumed host CPU / Ready (%).
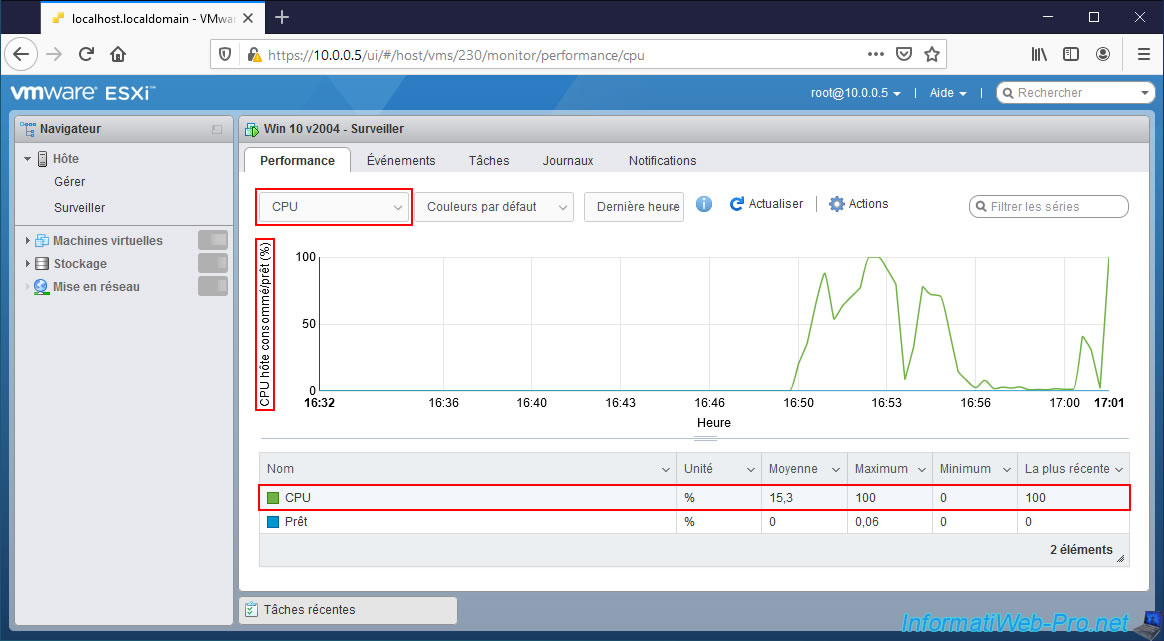
You can also monitor host processor (CPU) usage by a virtual machine, by clicking "Monitor" at the top of your VM's page.
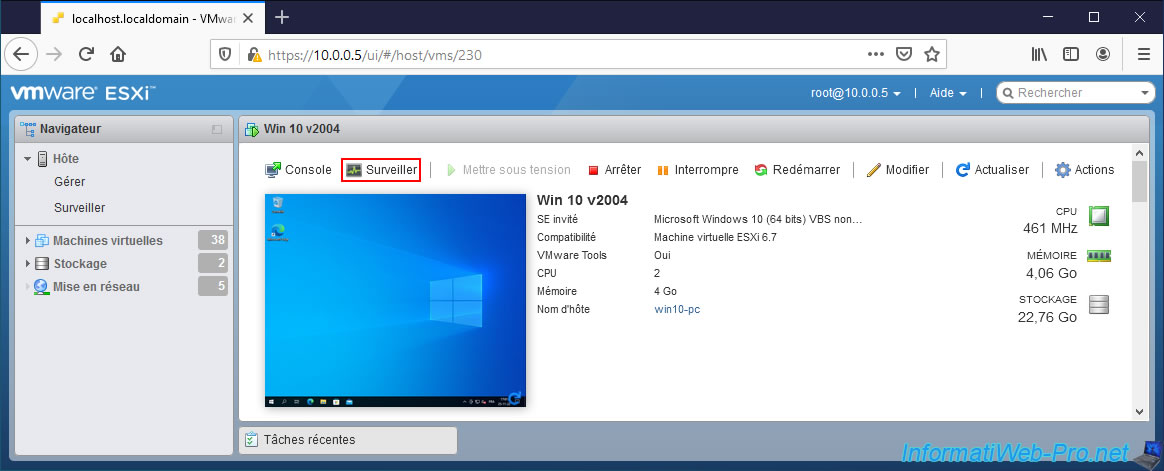
This time, you will only see the processor (CPU) utilization by this virtual machine.
Note that this is an average since you don't have the detail by core.
1.3. Guest processor (vCPU) usage by a virtual machine (VM) on Windows
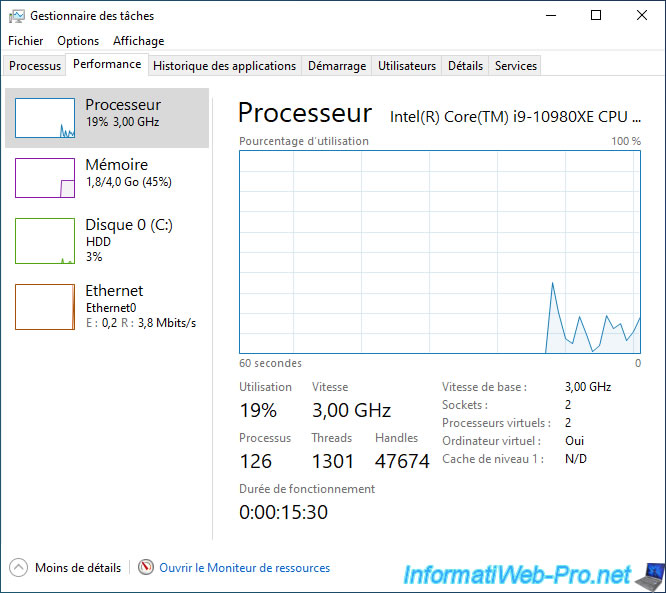
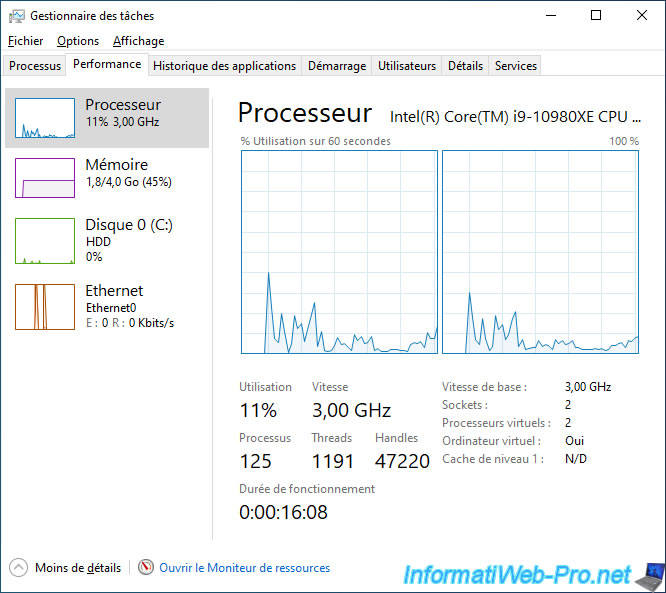
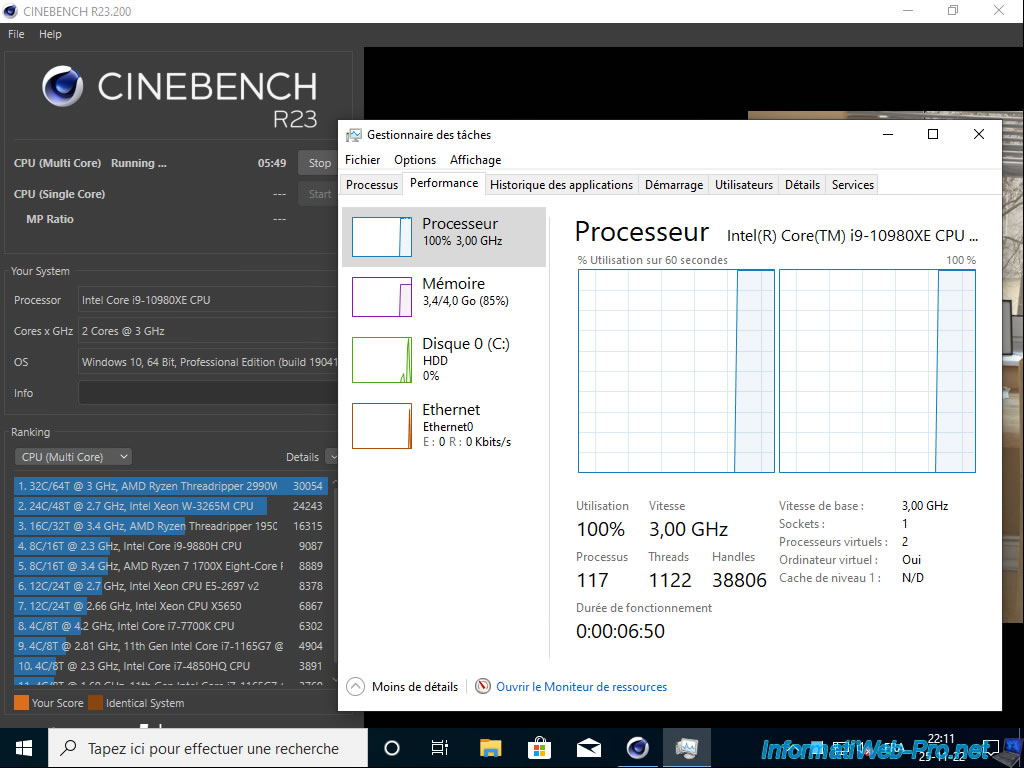
On Windows 10, you can monitor CPU usage from the guest operating system through the task manager.

If this appears (depending on the version of Windows used), click on : More details.

Go to the "Performance" tab, you will be able to monitor the guest CPU usage (what is allocated to the VM) globally.
At the bottom, you will find in particular the current frequency (speed) in GHz, the number of virtual processors (sockets) and the total number of cores (virtual processors) it has.
If you want to see the usage per CPU core, then right click on the graph and click : Change graph to -> Logical processors.
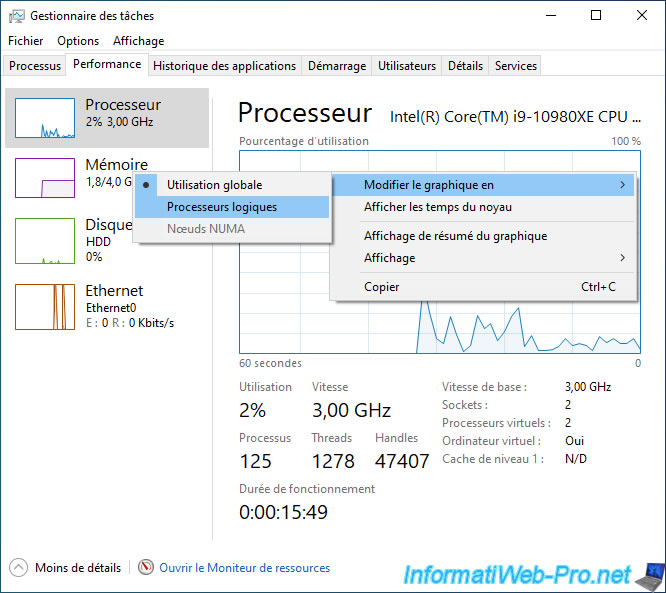
This time, you can check the usage by core.
This is very handy for verifying that specific software is using the new CPU hot-added to your virtual machine (if any).
Indeed, even if VMware ESXi allows you to add processors hot on a virtual machine, it's also necessary that the professional solution that you use in this virtual machine supports the use of processors added hot (= after the start of virtual machine).
2. Monitor processor (CPU) Ready state
The "Ready" state of the processor corresponds to the waiting time between 2 executions on the physical processor for a specific virtual machine.
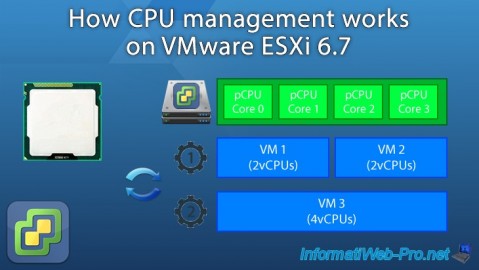
As you will see from the 2 examples below, it's best NOT to allocate too many CPU cores to your virtual machines.
Indeed, this can increase this waiting time (CPU Ready), or even penalize the other machines present on this VMware ESXi host.
2.1. Use virtual machines with a single vCPU
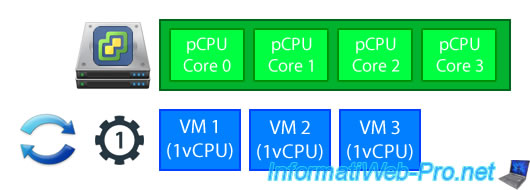
For the 1st example, we will use a VMware ESXi host with a processor having only 4 cores.
Note : for this tutorial, we used a VMware ESXi host virtualized on VMware ESXi.
On this VMware ESXi host, we created 3 identical virtual machines.
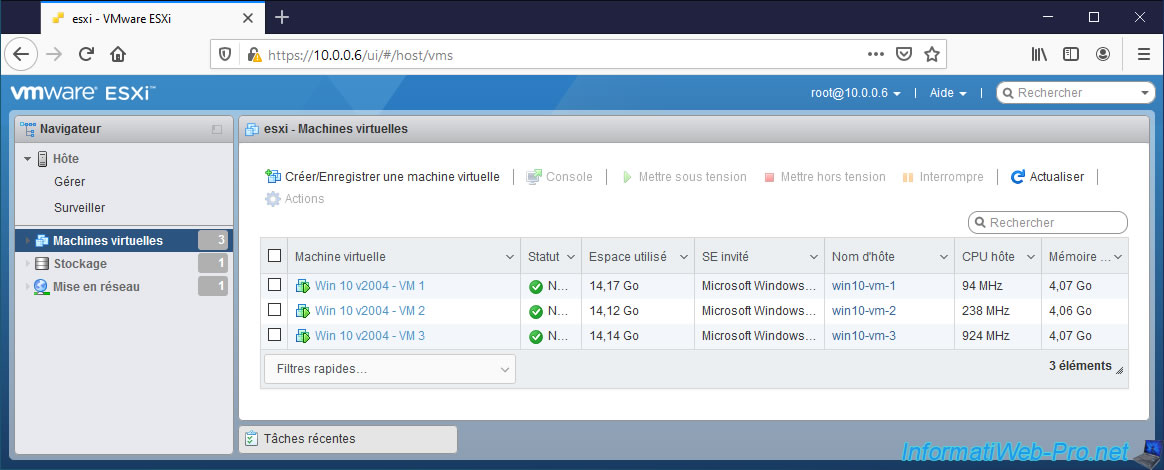
For this example, we have allocated a single CPU core to each.
Technically, if the virtual machines are using their guest processor (vCPU) at 100% all the time, it will mean that the host processor (pCPU) will be used at maximum at 75% because of these virtual machines.
To demonstrate this, we used stress test software for the processor (CPU).
By opening the task manager in the virtual machine, we can see that the processor is used at 100% constantly.
Warning : we perform our tests with virtual machines located on a virtual VMware ESXi host, which prevents us from accidentally overheating the processor of our physical PC.
Indeed, physically, there are only 4 cores (allocated to the virtual host) which can be used at most out of the 18 physical cores that our processor has.
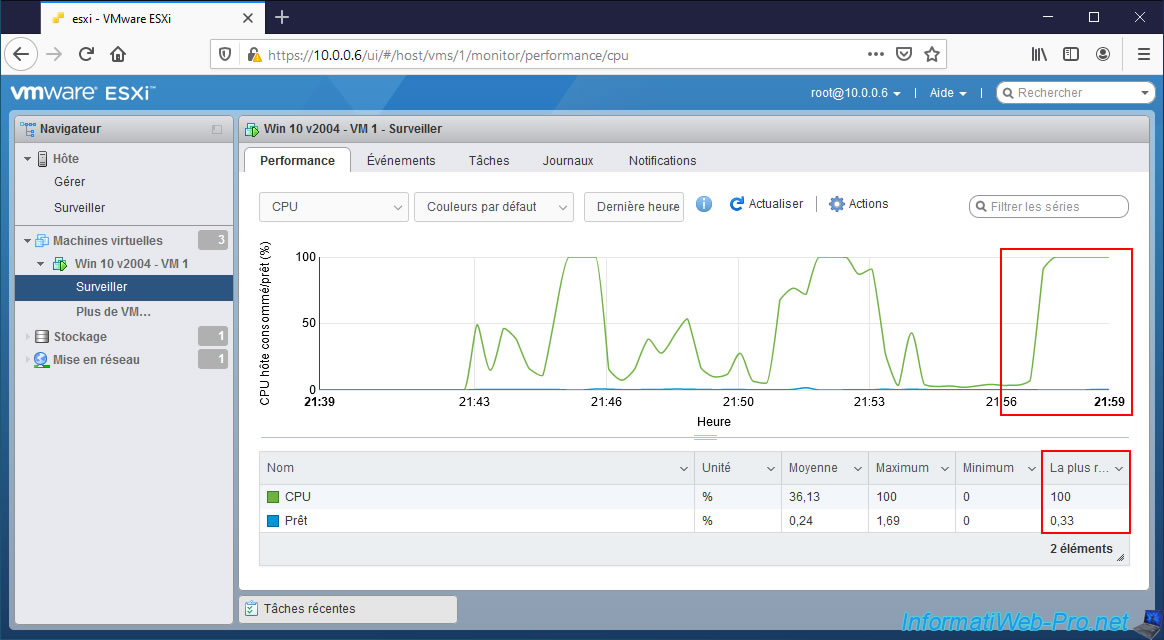
On the page of one of your virtual machines, click "Monitor".
As you can see, the host CPU is 100% utilized all the time and the host CPU wait time for this virtual machine is only 0.33%.
There is therefore no real waiting since VMware ESXi can manage the execution of the 3 virtual cores on these 4 physical cores without creating a queue.
Source : CPU (%) - VMware Docs.
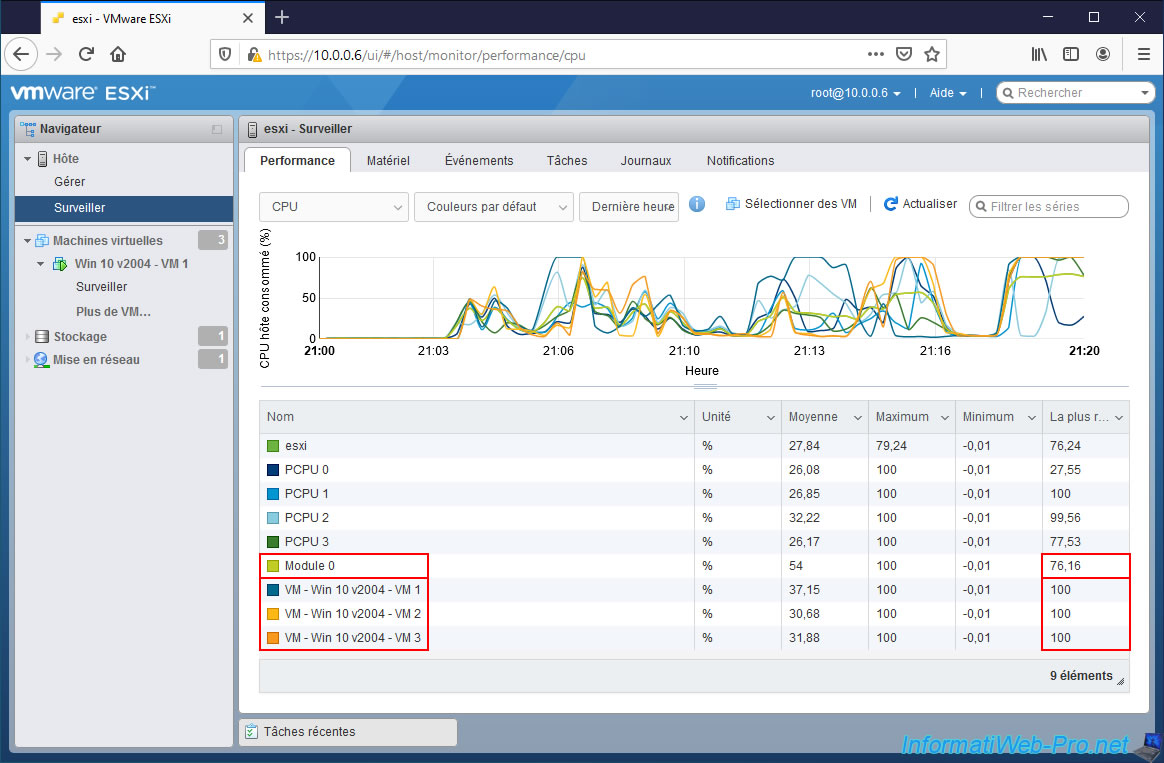
If you go to "Host -> Monitor" and click on "Select VMs" to add your 3 virtual machines in this graph, you will see that :
- esxi / Module 0 : the physical processor (pCPU) of the server is used at approximately 75%.
Which is normal given that 3 out of 4 cores are used by your virtual machines. - VM - [Name of each VM] : guest processor (vCPU) of each virtual machine is 100% utilized (thanks to CPU stress test program).
Note : the "PCPU X" values correspond to the use of each core of the physical processor (pCPU).
In this case, the scheduling of the host's physical processor will be very simple, because your server can simultaneously execute all the processor instructions of your virtual machines and repeat this indefinitely.
This means that there will be no waiting for your virtual machines between 2 instructions to be executed on the physical processor (pCPU).
Note that since VMware vSphere 6.7 U2, it's possible to put one vCPU per logical core. So, generally, 2 vCPUs per physical core thanks to hyperthreading at Intel.
Source : Performance of vSphere 6.7 - Scheduling Options (page 4).
Warning : since generation 12 of Intel processors, there are now 2 types of cores.
The "Performance" cores (= 2 logical cores per physical core) and "Efficient" cores (= 1 logical core per physical core).
Source : Intel Unveils 12th Gen Intel Core, Launches World’s Best Gaming Processor, i9-12900K.
If you go to the "Host" menu, you will see again that the physical processor is approximately 75% used.
For the moment, your 3 virtual machines are therefore fluid and your server will continue to operate correctly despite the CPU stress test launched in these 3 virtual machines.
2.2. Use virtual machines with multiple vCPUs
For the 2nd example, we reused the 3 virtual machines created previously, but this time, we allocated :
- 2 cores to "Win 10 v2004 - VM1" and "Win 10 v2004 - VM2" virtual machines.
- 4 cores to "Win 10 v2004 - VM3" virtual machine.
Which means that virtually 8 cores will be used by these virtual machines, while our VMware ESXi host only has 4.
There will therefore be a queue for the execution of instructions on the physical processor (pCPU) for these virtual machines.

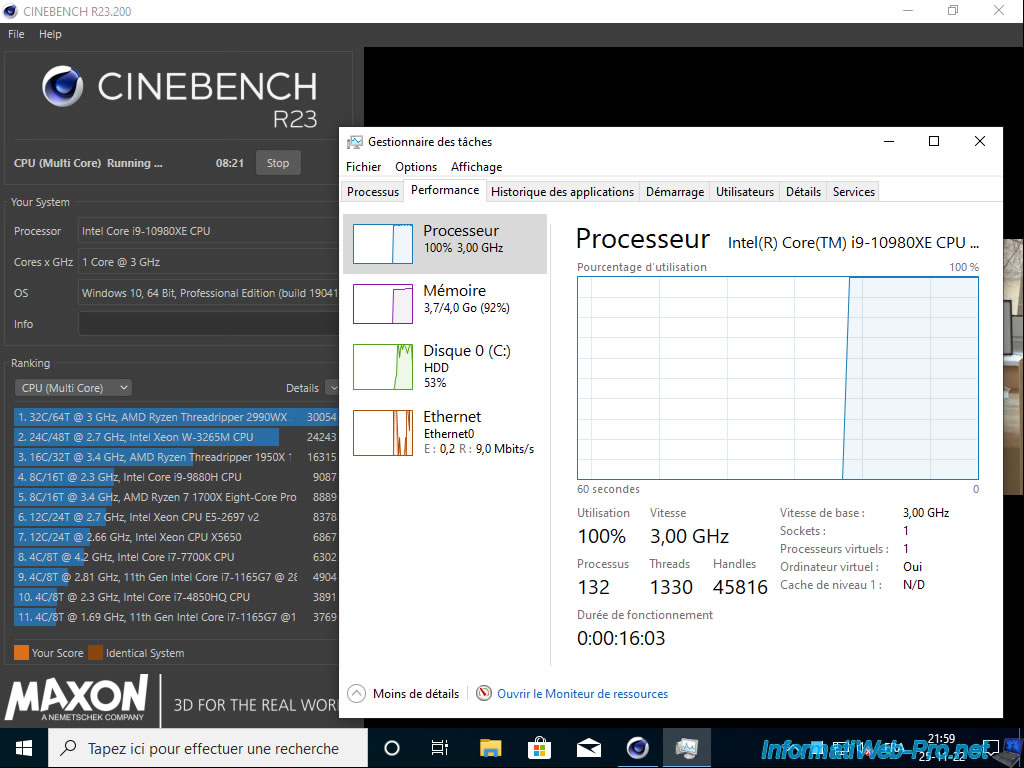
As before, we launched our 3 virtual machines simultaneously and we launched the CPU stress test program in them so that the guest processor was used at 100% at all times.
Note that Cinebench can perform a CPU stress test on all CPU cores if desired.
What we have done.
So, if you launch task manager and view the CPU utilization graph by logical processor, you will see that all cores are used at 100%.
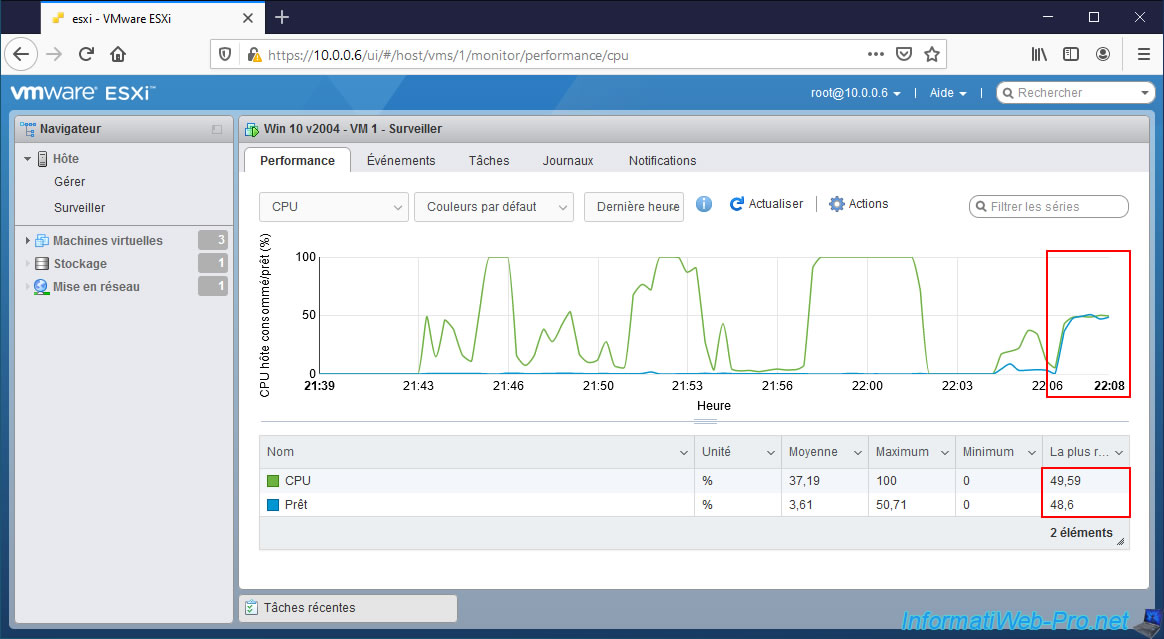
As you will be able to very easily see in the CPU utilization graph of your virtual machines, the host CPU is now only 50% used since 50% of the time, your virtual machine will have to wait in order to continue to execute instructions on the physical processor (pCPU).
- CPU - 50 : the virtual machine only uses the physical processor at 50%.
- Ready - 50 : the virtual machine is waiting 50% of the time.
Which corresponds to the waiting time between 2 executions of instructions on the physical processor by this virtual machine.
The higher this value, the longer the waiting time and therefore the longer the virtual machine will take to react.
This proves that creating virtual machines with too many cores can quickly penalize the virtual machine concerned, but also the other virtual machines of this host, because their waiting time will also have increased.
If you want to buy a new PC to learn to use VMware ESXi, preferably buy a processor with more cores rather than a high frequency.
Indeed, this will allow you to run several virtual machines simultaneously (as in the 1st example) without this waiting time appearing or being too high.
Also, a processor with a lower frequency is more stable than a processor with a high frequency. Which is better for a server.
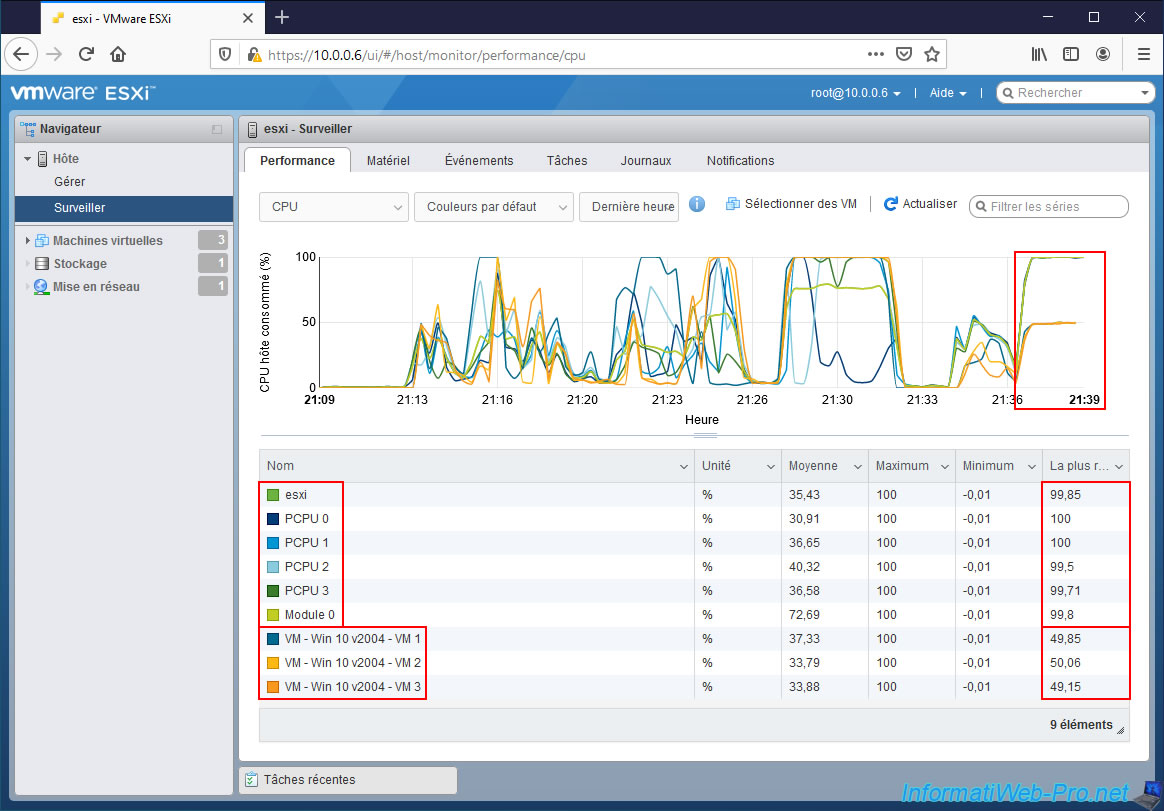
If you go to the "Host -> Monitor" menu, you will see that :
- esxi / Module 0 : the physical processor (pCPU) is used at approximately 100%.
In other words, your server's physical processor is currently overloading.
This penalizes your entire server : its virtual machines and its services. - PCPU X : all the cores of your physical processor (pCPU) are obviously also used at 100%.
- VM - [name of each VM] : guest CPU of each virtual machine can only be used at 50% in our case, despite 2 virtual machines have 2 cores and single virtual machine has 4 cores.
Indeed, since the number of virtual processor cores allocated to your virtual machines exceeds the number of physical processor cores, a queue is created by your hypervisor for the execution of instructions on the physical processor.
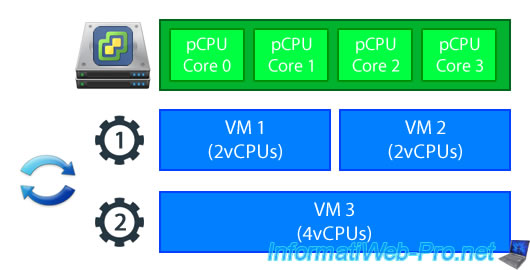
The CPU scheduling of your VMware ESXi host is therefore this one :
- in a first time, your VMware ESXi host will simultaneously execute the processor instructions of your 2 virtual machines with 2 cores.
- in a second time, your VMware ESXi host will execute the processor instructions of your 3rd virtual machine (with 4 cores).
- then, it will reexecute the instructions of VMs 1 and 2, then those of VM 3, and so on.
Which means that the physical processor is only available for these virtual machines once out of 2 (so 50% of the time, as you can see with the graph generated by VMware ESXi).
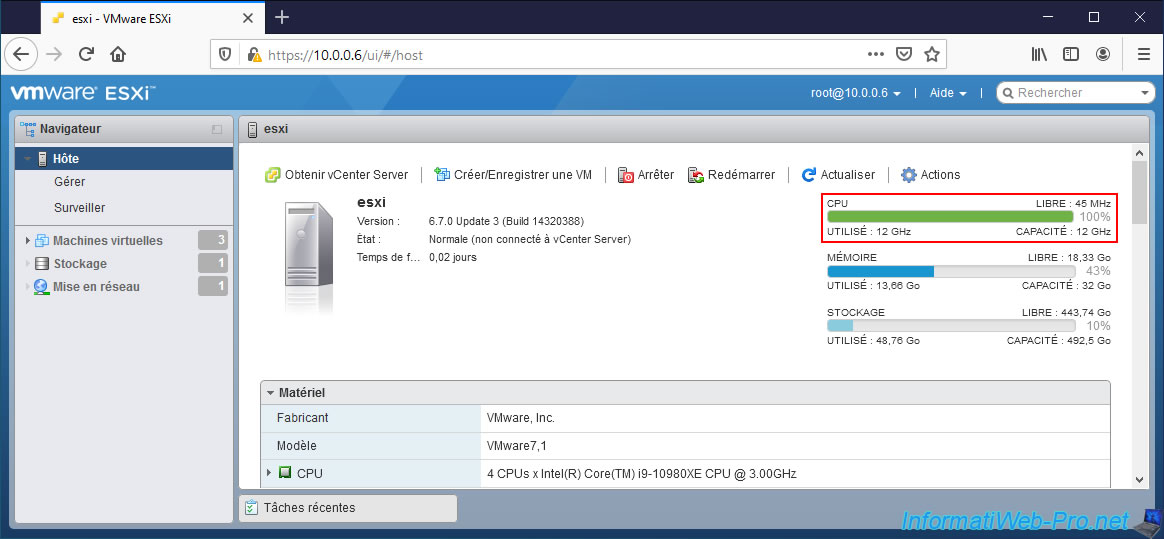
If you go to the "Host" menu, you will see that your host's processor is saturated.
Share this tutorial
To see also
-

VMware 4/14/2023
VMware ESXi 6.7 - Best practices for creating a VM
-

VMware 2/17/2023
VMware ESXi 6.7 - Configure your virtual machines settings
-

VMware 6/2/2023
VMware ESXi 6.7 - Connect a smart card reader to a VM
-

VMware 10/19/2022
VMware ESXi 6.7 - DirectPath I/O (PCI passthrough)
You must be logged in to post a comment