How CPU management works on VMware ESXi 6.7
- VMware
- 31 March 2023 at 11:24 UTC
-

- 2/2
3. Monitor processor (CPU) CO-STOP state
Previously, with VMware ESXi 2.x, in order for a virtual machine with 4 vCPUs to be scheduled on the physical processor, it was necessary to wait until 4 cores of the physical processor were available simultaneously.
This delayed execution for these virtual machines.
Since VMware ESXi 3.x, scheduling is managed by vCPU.
Which means that a virtual machine with 4 vCPUs can be planned in a fragmented way thanks to the costop system.
For example, VMware ESXi can manage the execution of the first 2 vCPUs when 2 cores of the physical processor are available, then manage the execution of the 2 other cores (one by one if necessary), when these are finally available.
The VMware ESXi hypervisor will then manage the synchronization of the results obtained so that the guest operating system thinks that the execution occurred simultaneously on all cores (which is normally required).
This costop system makes better use of the physical processor and therefore improves the performance of your virtual machines.
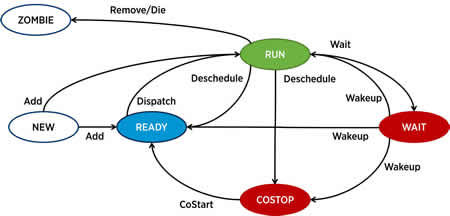
The execution on a core can be in different states : RUN, READY, WAIT or COSTOP.
To begin with, when an execution must be performed on a core, it can be in a RUN state (if a core is available) or in a "READY" state (if it's not).
If the execution is in a READY state, it will then enter a RUN state.
Then, this execution can revert to READY or COSTOP. The execution in COSTOP will then be started (co-start) later to enter a READY state.
An execution in RUN state will enter WAIT state if it blocks on a resource (because it's not available at the moment).
Source : The CPU Scheduler in VMware vSphere 5.1 (pages 4 and 5).
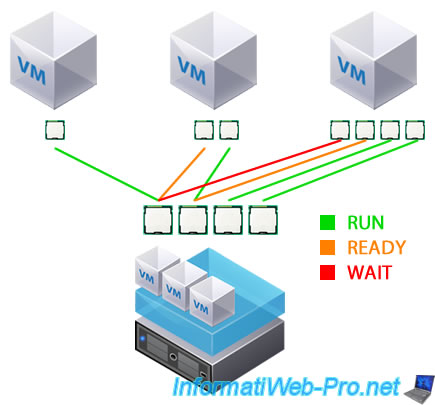
In example 2 (which you will see later in this tutorial), we will use 3 virtual machines with respectively : 1 vCPU, 2 vCPUs and 4 vCPUs.
As you can see, some vCPUs will be in RUN state, because physical processor cores are currently available. But other vCPUs will be in READY or even WAIT state, depending on the availability of physical processor cores.
This is obviously an example and varies depending on the virtual machines currently running, their number of cores and the availability of physical processor cores.
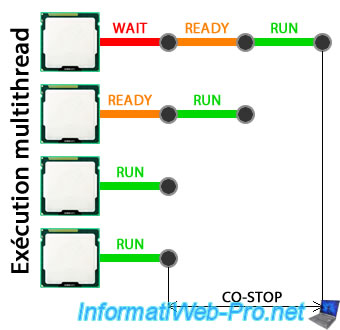
To illustrate this CO-STOP system, here is the multithreaded execution graph (multi-cores / multi-vCPUs) of the virtual machine with 4 cores.
The virtual machine executes the instructions of 2 cores thanks to the 2 cores currently available on the physical processor.
Then, the execution of the 3rd core which was in READY state previously will be executed on the core which has just become free a little later.
On the other hand, the 4th core was already used by a VM and in READY for the vCPU of a 2nd VM.
When the 2nd VM (with 2 cores in this case) executes its instructions on this core, our VM with 4 cores will have its vCPU in READY state on this core.
Once the 2nd VM has completed its execution on this core, our virtual machine will be able to use it (hence the RUN state).
The value of CO-STOP corresponds to the time that elapsed between the end of the execution of the fastest core and the end of the execution of the slowest core.
Source : pages 8 and 9 of the link cited above.
3.1. No CO-STOP with virtual machines with 1 vCPU
As you will understand, CO-STOP only occurs when using virtual machines with multiple cores.
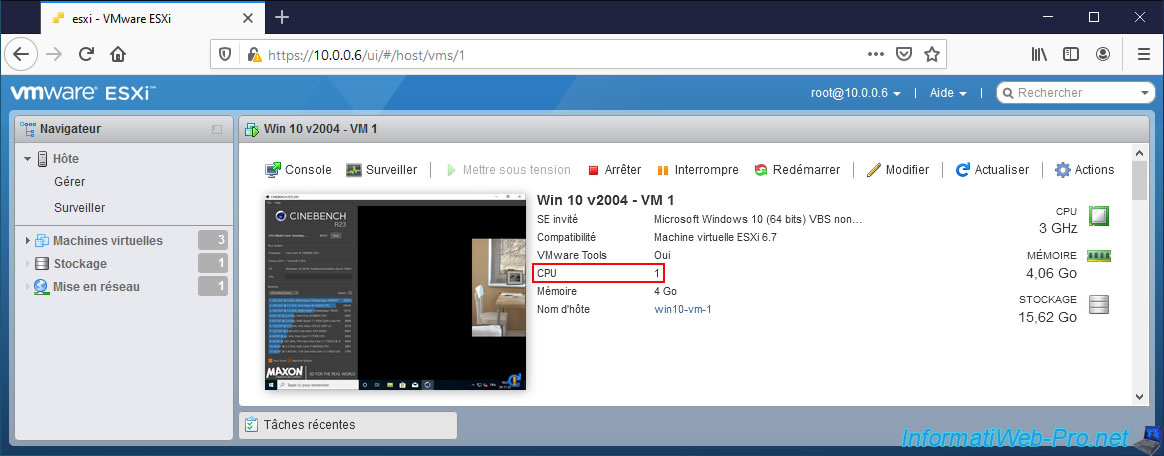
Here is a 1st example with 3 virtual machines with one vCPU each where you will see that the CO-STOP will remain at 0.
Note : again, we ran the CPU stress test software on these virtual machines to use their guest processor (vCPU) at 100%.
If you look at your host's CPU utilization graph, you will see that your virtual machines' guest CPU (vCPU) is utilized at 100% and in our case our server's physical CPU is utilized at around 75% (given that 3 cores are used out of 4).
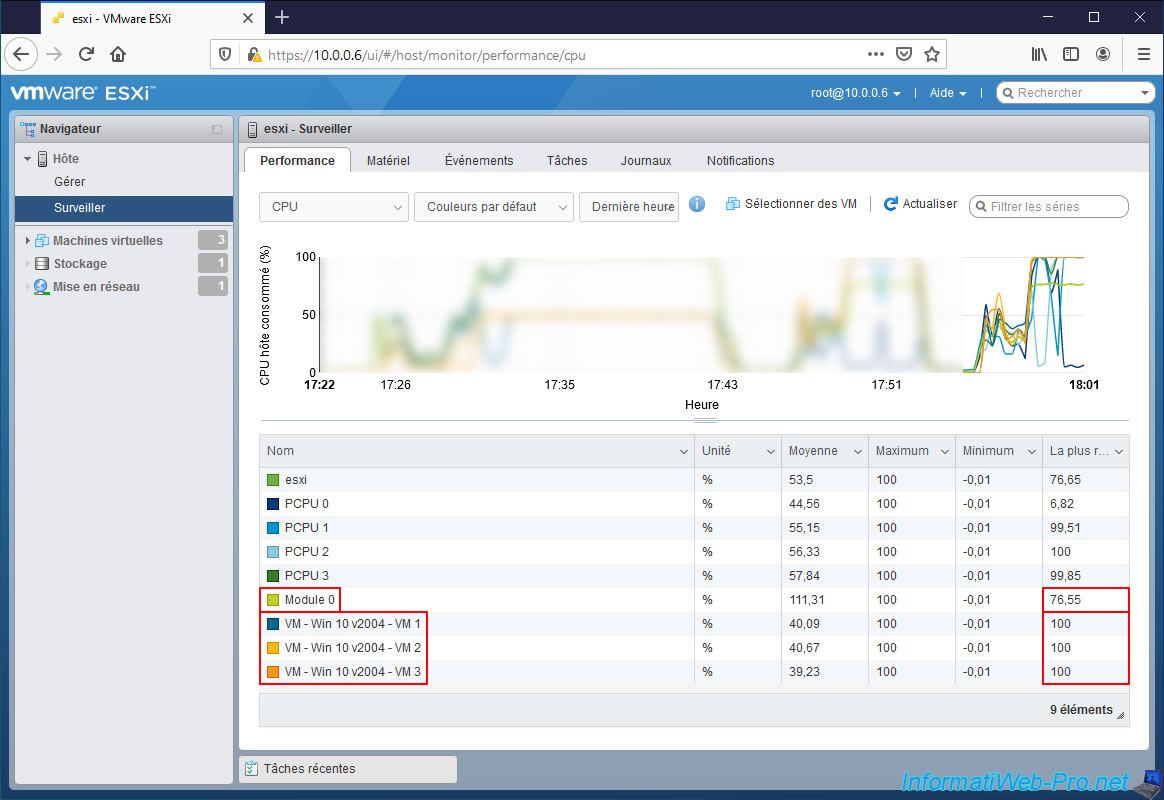
Enable SSH on your VMware ESXi host and run the "esxtop" command.
Plain Text
esxtop
As you can see, virtual machines stay in RUN state all the time since physical CPU cores are always available for them.
There is no wait (READY / %RDY) for the reason mentioned above nor CO-STOP (%CSTP) since our virtual machines only have one vCPU each.

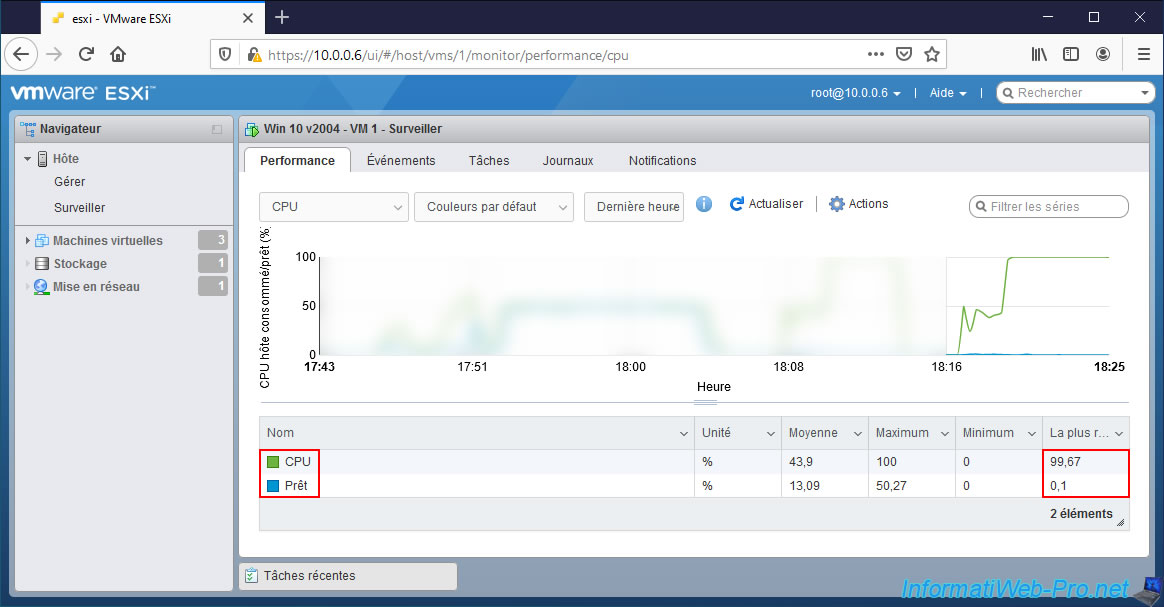
For CPU usage and READY state, you can also see it in your virtual machine's performance graph.
But the CO-STOP value doesn't appear here.
3.2. Appearance of CO-STOP with virtual machines with several vCPUs
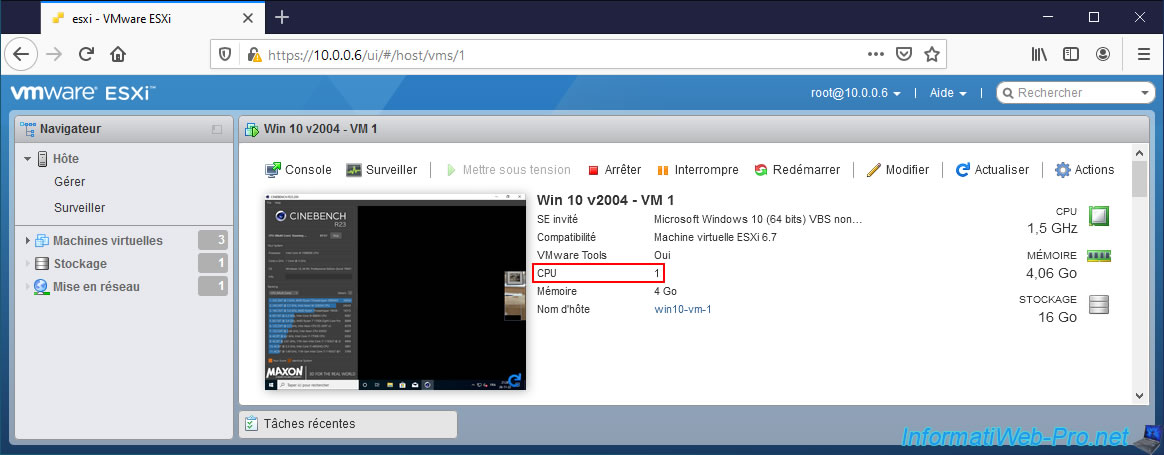
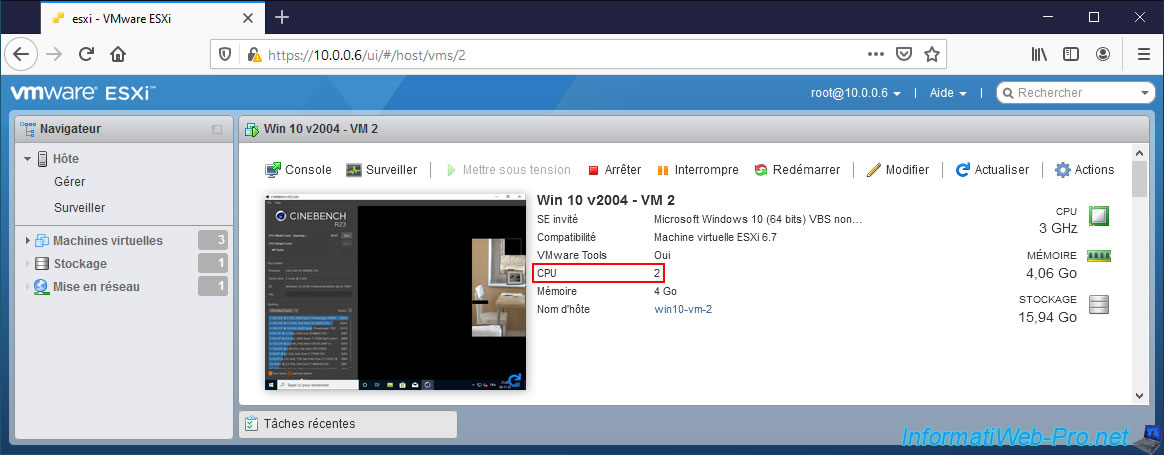
For this 2nd example, we will use 3 virtual machines with respectively : 1 vCPU, 2 vCPUs and 4 vCPUs.
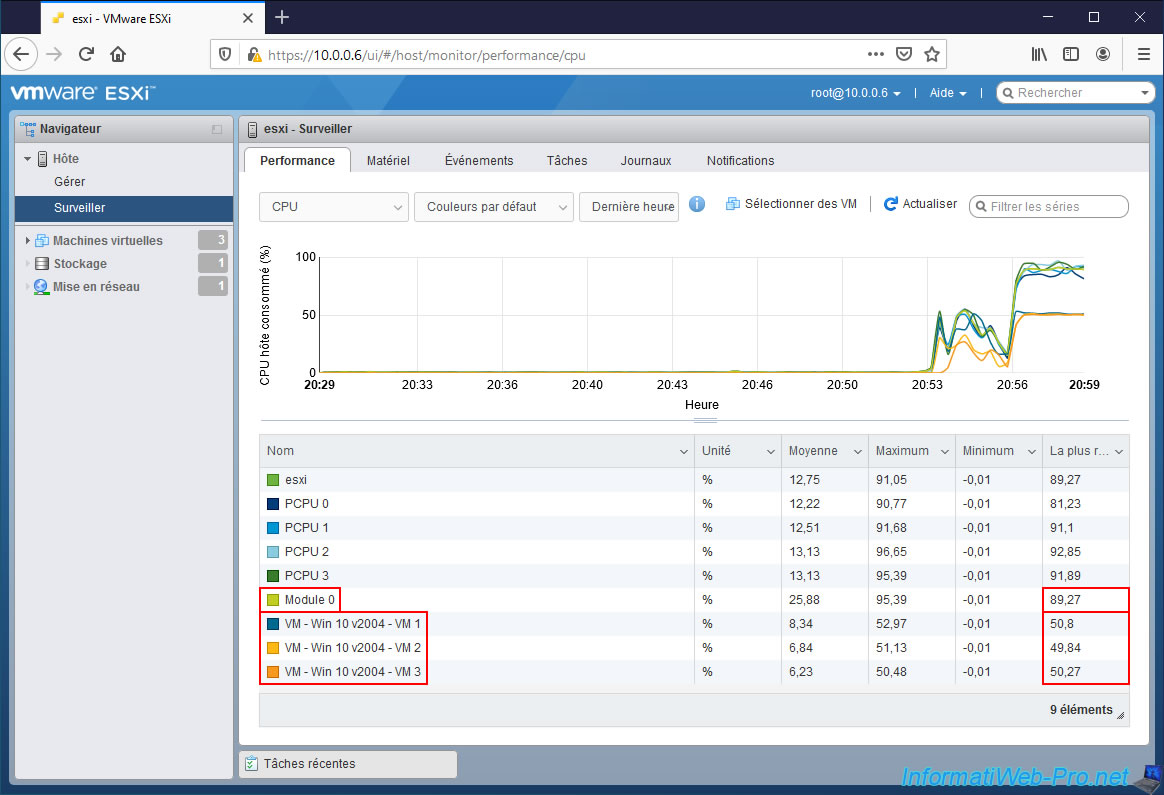
Which corresponds to the graphs presented at the beginning of step 3 of this tutorial.
VM 1 has 1 vCPU.
VM 2 has 2 vCPUs.
VM 3 has 4 vCPUs.
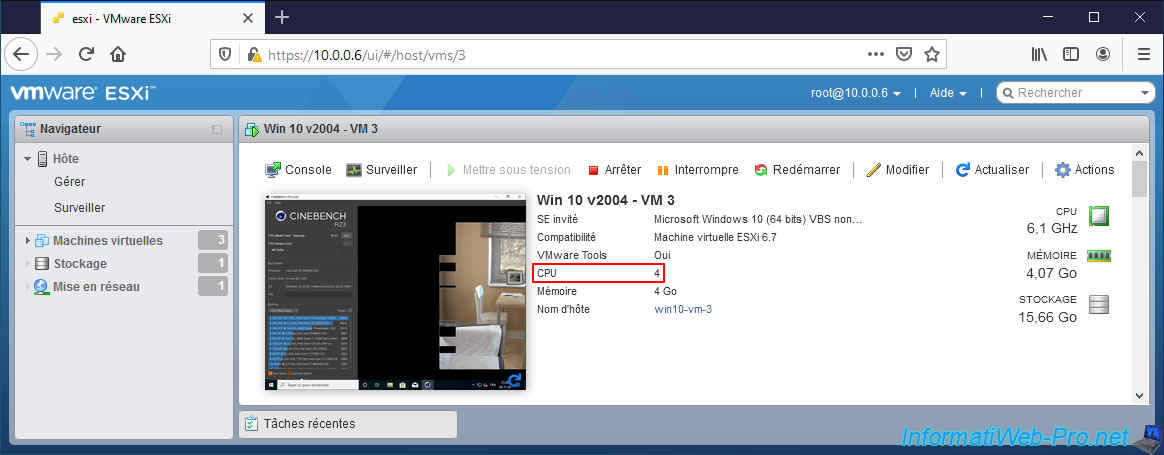
We ran the CPU stress test software again on these 3 virtual machines and you can see that the guest processor (vCPU) of the virtual machines is about 50% utilized (because of the READY state explained in step 2 of this tutorial).
Again, to see the CO-STOP value, enable SSH on your VMware ESXi host (if not already enabled) and use the "esxtop" command.
Plain Text
esxtop
As you can see, CO-STOP (%CSTP) appears for 2 virtual machines.
We quickly understand that the displayed virtual machines are :
- VM 3 with 4 vCPUs, hence the high CO-STOP since the delay between the end of execution on the fastest core and the slowest one is the highest.
- VM 2 with 2 vCPUs, hence the CO-STOP that appears, but which is lower than the previous VM.
- VM 1 with 1 vCPU, hence the CO-STOP which remains at 0. Indeed, there can't be any delay between execution on the different cores since the virtual machine only uses one core.
Source : Determining if multiple virtual CPUs are causing performance issues (1005362).

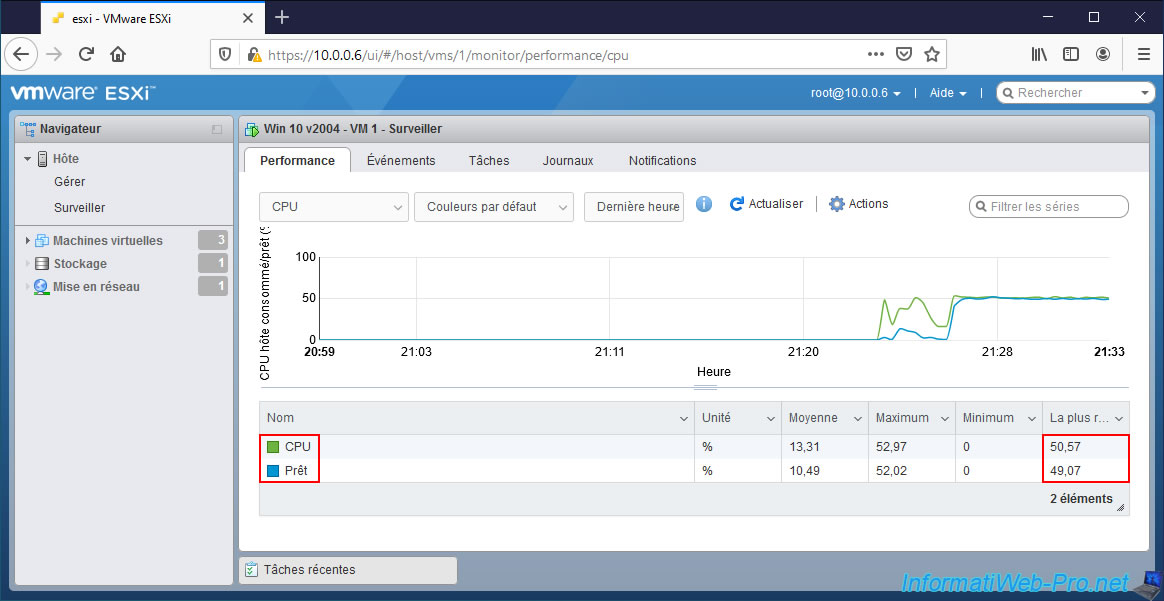
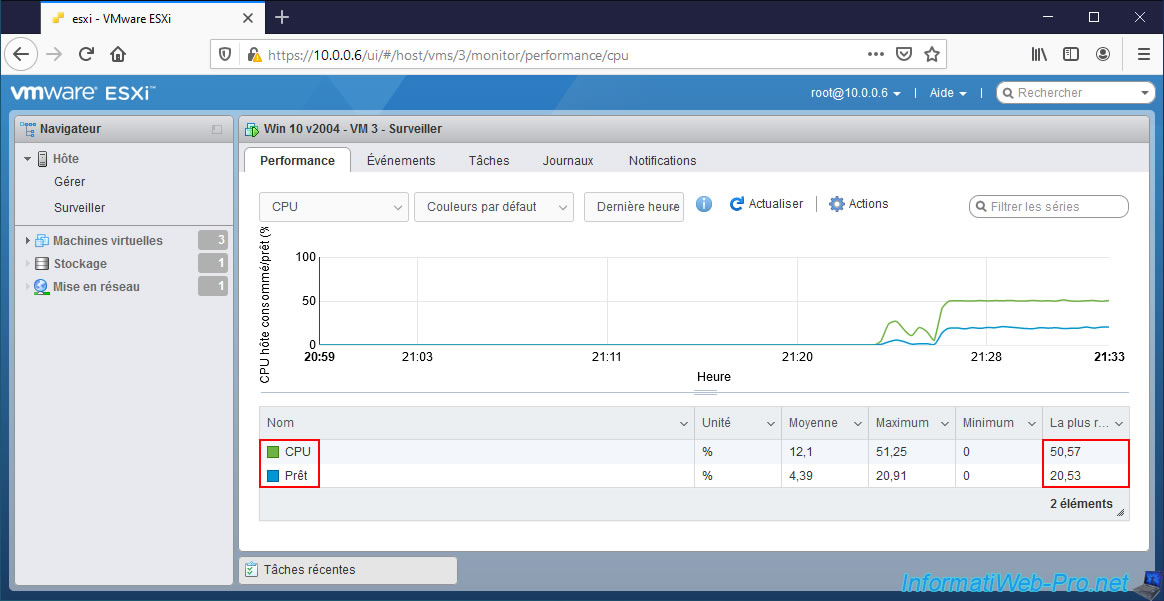
Again, if you look at the CPU performance graph of your machines, you will see the CPU usage and the "Ready" state appear.
But, the CO-STOP value will not appear here.

4. NUMA alignment
If you have a server with several cores and it supports NUMA technology, it's possible to manage NUMA alignment so that your virtual machines benefit from better performance.
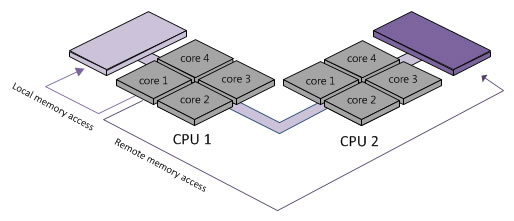
Indeed, when you have a server with several physical processors, they have faster access to a local memory bank (Memory Node) via a very fast bus.
Even if they can also access other memory banks via slightly slower buses.
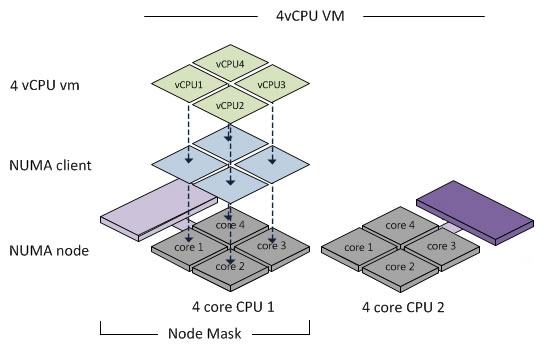
In this case, you can see that we have a virtual machine with 4 vCPUs that is correctly aligned with the physical server's NUMA topology.
Indeed, the VMware ESXi hypervisor will correctly place the 4 vCPUs of our virtual machine on the cores of a single processor (via the NUMA client) so as to only use the memory of the memory bank (Memory Node) close of the physical processor concerned.
Thus, the exchanges between the cores of the processor and the memory bank will be very fast given that it's the very fast bus which will be used.
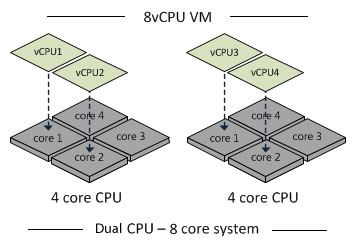
On the other hand, if the virtual machine is not aware of the NUMA topology of the physical server, then the cores may not be correctly assigned.
In this case, the VMware ESXi hypervisor may assign 2 vCPUs on one physical processor and 2 vCPUs on another physical processor.
This will have the consequence of using memory in 2 memory banks and therefore of using the very fast and slower buses.
The performance of the virtual machine will therefore not be optimal.
Warning : enabling the hot addition of CPUs in the virtual hardware of your virtual machine deactivates NUMA support for it.
Source : Using Virtual NUMA - VMware Docs.
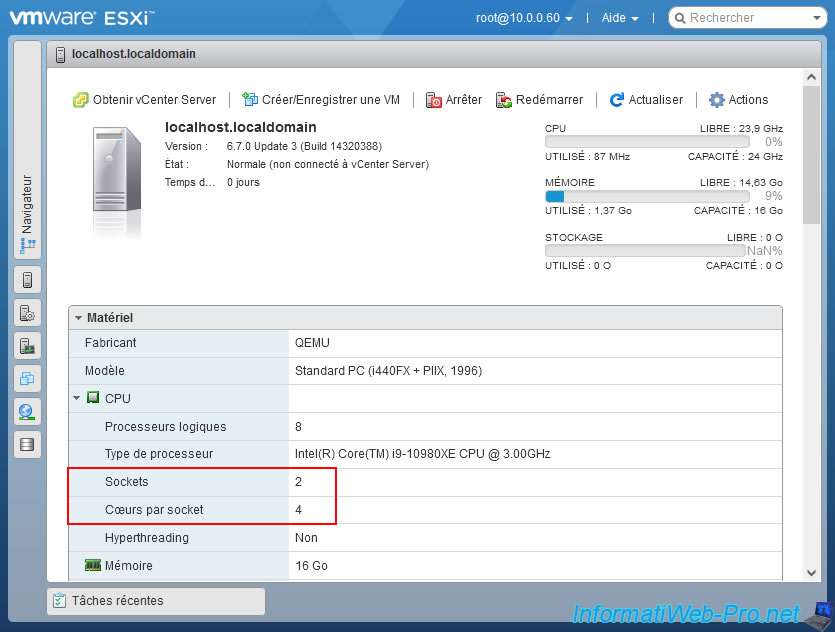
To try to show you this, we tried to virtualize VMware ESXi on Unraid (which allows you to emulate a NUMA topology and to customize other options).
For this tutorial, we therefore created a virtual machine under Unraid with :
- 8 logical processors which are seen as 2 separate processors with 4 cores each.
- 16 GB of RAM.
- a NUMA topology of 2 physical processors with a memory bank of 8 GB each.
Hence the appearance of the manufacturer QEMU on which the Unraid virtualization system is based.
Note that VMware ESXi doesn't work properly on Unraid.
ESXi datastores don't work, in our case.
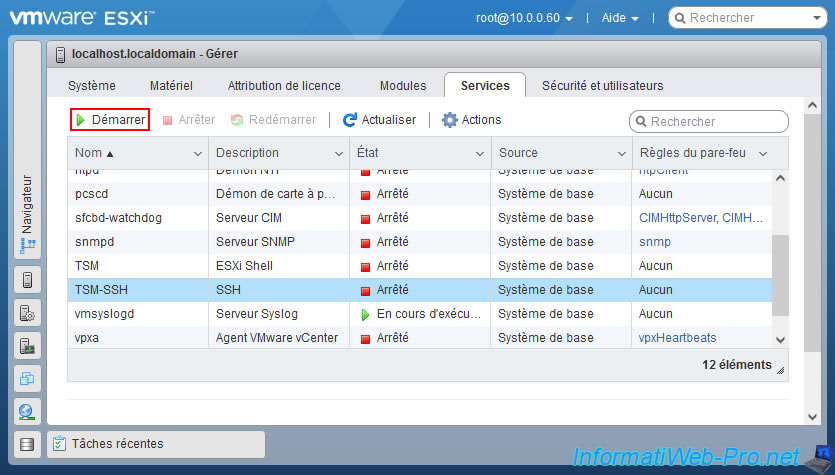
Enable the SSH protocol of your VMware ESXi hypervisor.
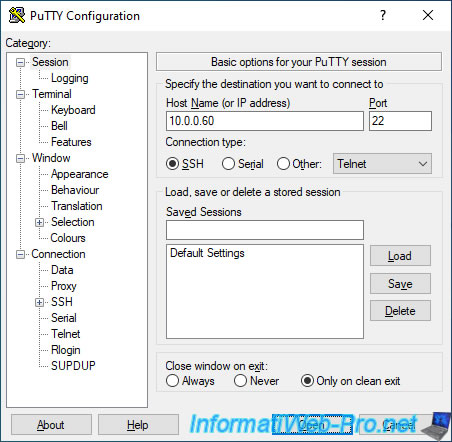
Connect in SSH via PuTTY (for example).
To verify that a NUMA topology is present in your case, use the command below.
Plain Text
esxcli hardware memory get | grep NUMA
In our case, we can see that there are 2 NUMA nodes.
Plain Text
NUMA Node Count: 2
Source : Solved: Re: How to check NUMA Node on ESXi host - VMware Technology Network VMTN.
Authenticate as root and run the command :
Plain Text
esxtop

To begin, press "m" to display NUMA memory information.
Indeed, at the top, you will see a "NUMA" line with the amount of memory of the different NUMA memory banks of your physical server.
In our case, there are 2 memory banks of 8 GB each.

Press "V" to display only the list of virtual machines in the table.
Note : in our case, since the datastores don't work with this virtualized VMware ESXi host, we don't have a virtual machine displayed.

Press "F" to display this menu and enable the "NUMA STATS = Numa Statistics" option by pressing "G".

An asterisk (*) will appear in front of the line "G: NUMA STATS = Numa Statistics".
Press Enter.
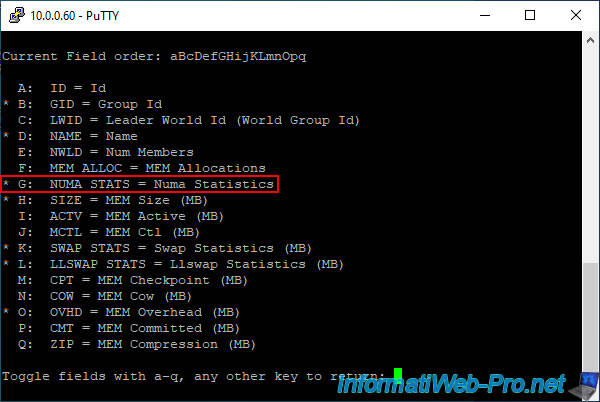
To verify that a virtual machine is correctly aligned, simply check if the value indicated in the "N%L" column is equal to 100%.
If a dash (-) is displayed, the NUMA topology is not used and if the value is less than 100%, the machine is not fully aligned with respect to the NUMA topology of your physical server.

Share this tutorial
To see also
-

VMware 4/14/2023
VMware ESXi 6.7 - Best practices for creating a VM
-

VMware 2/17/2023
VMware ESXi 6.7 - Configure your virtual machines settings
-

VMware 6/2/2023
VMware ESXi 6.7 - Connect a smart card reader to a VM
-

VMware 10/19/2022
VMware ESXi 6.7 - DirectPath I/O (PCI passthrough)

No comment