Create and manage alarms in the vSphere Client on VMware vSphere 6.7
- VMware
- 26 June 2024 at 07:27 UTC
-

- 2/2

2. List of triggered alarms
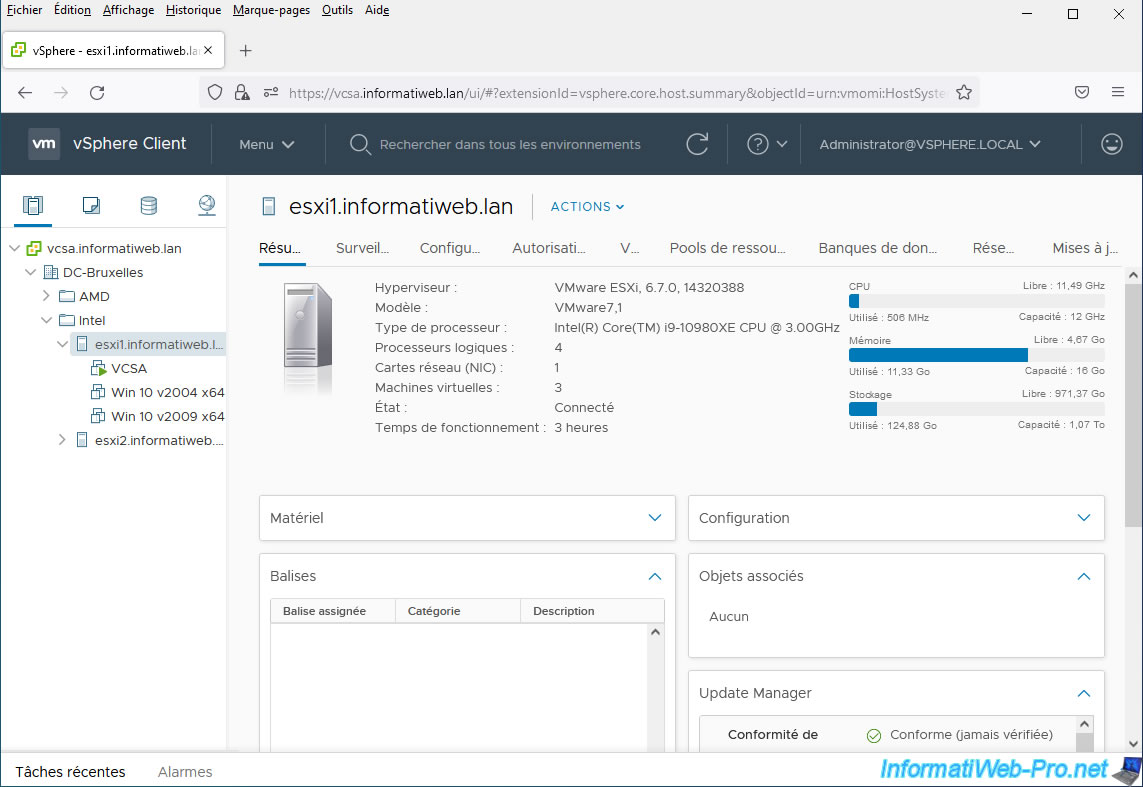
At the moment, the RAM used on our VMware ESXi host is 11.33 GB out of 16 GB.
Which corresponds to approximately 71% RAM usage.
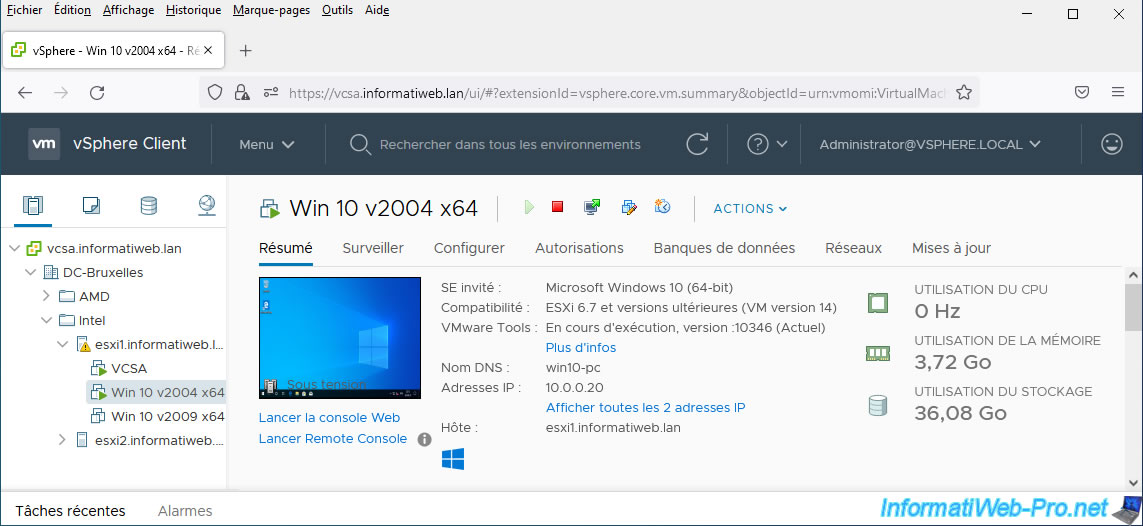
We start a virtual machine and we see that it is currently consuming 3.72 GB.
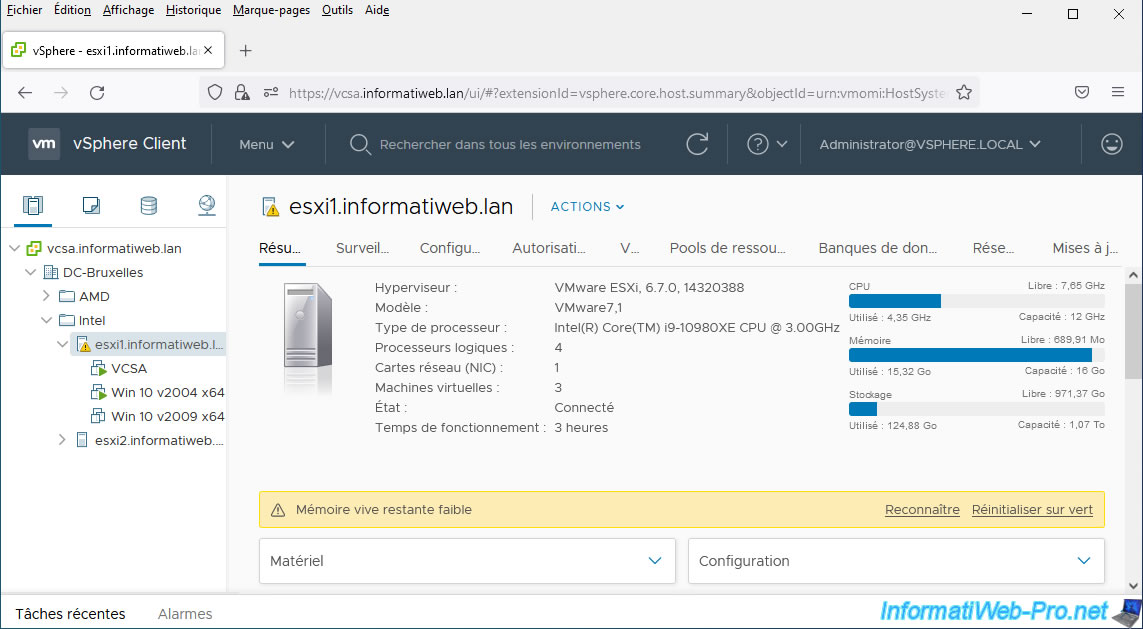
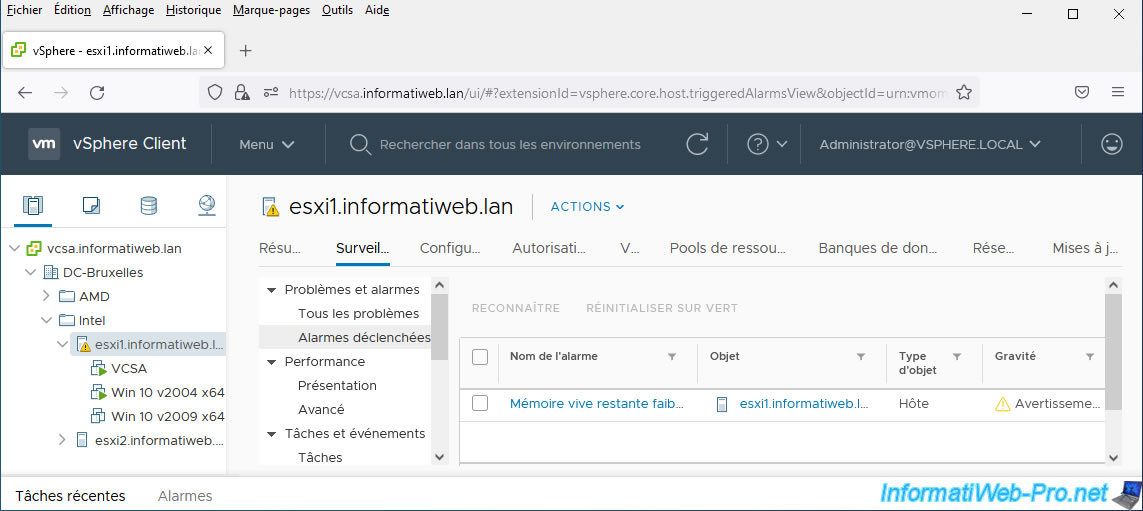
If you look at our VMware ESXi host icon in the left column, you will see that a warning (yellow triangle) has appeared on it.
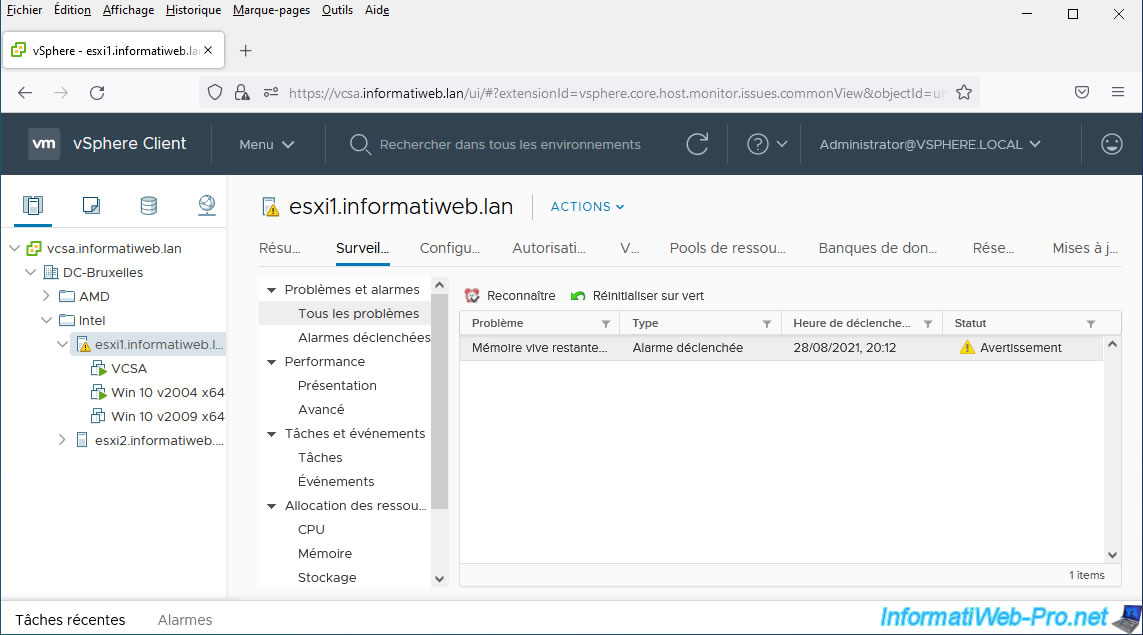
If we select our VMware ESXi host, we can see that VMware vCenter Server has triggered our "Low RAM Remaining" alarm and is displaying this as a warning.
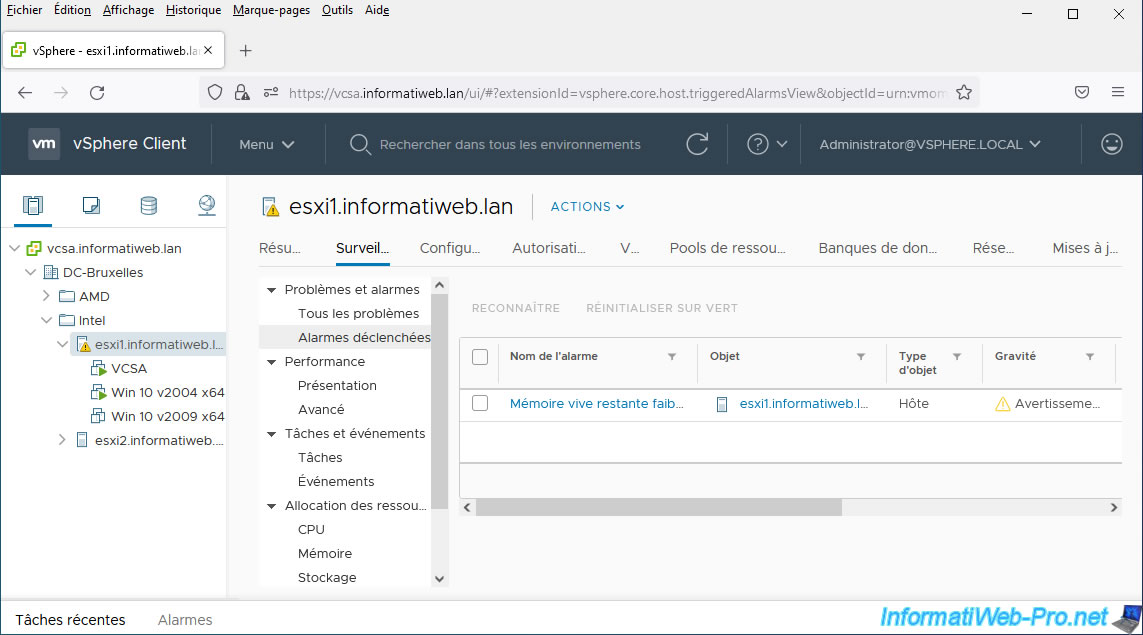
Note that triggered alarms are also visible by going to the "Monitor" tab of the object concerned, then in the section: Issues and Alarms -> Triggered Alarms.
Here, you will be able to see:
- Alarm Name: the name of the alarm triggered by vCenter Server
- Object: the name of the object concerned by this alarm.
- Object type: the type of object concerned. Here, a host (VMware ESXi).
- Severity: the status with which it must be displayed. In this case, as a warning. The other possible value being: critical.
- Trigger Time: the date/time the alarm was triggered
- Acknowledge Time: the date/time a user clicked "Acknowledge" for this alarm
- Acknowledged By: domain and username of the user who clicked "Recognize" for it
You will also see the alarms that have been triggered in the section: Issues and Alarms -> All Issues.
- Issue: the name of the alarm triggered
- Type: alarm triggered
- Trigger Time: the date/time this alarm was triggered
- Status: the status of this alarm. Namely: warning or critic.
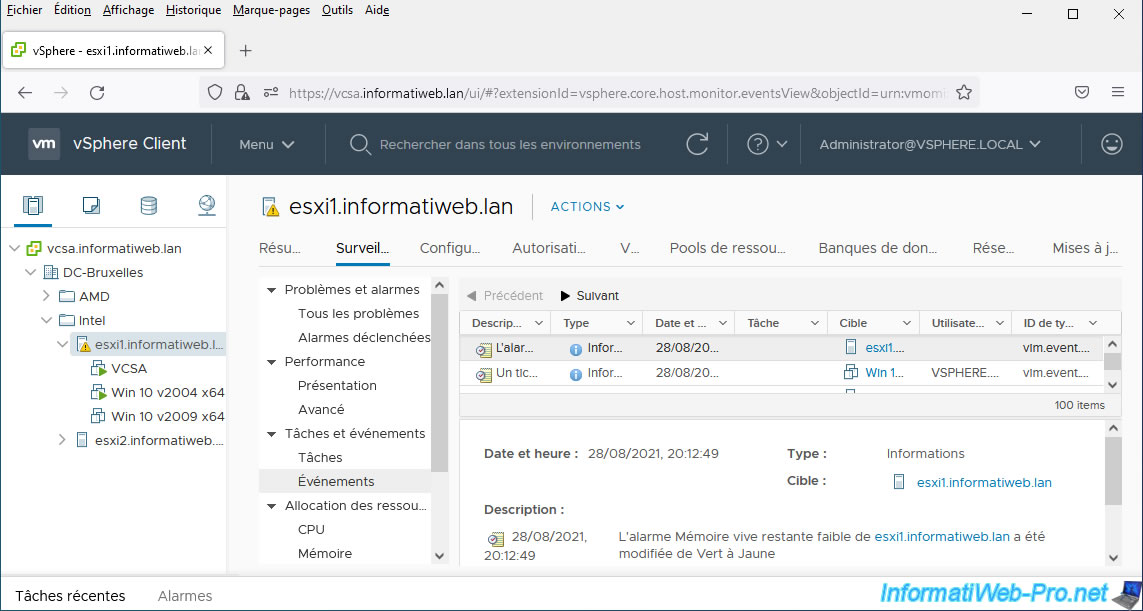
Finally, if you go to the "Tasks and Events -> Events" section of the object concerned, you will also see the triggering of these alarms appear.
If you select this event "The alarm [alarm name]...", you will be able to see:
- Date and time: date/time this alarm was triggered
- Type: Information
- Target: the object concerned by this alarm
- Description: a message indicating that the [alarm name] alarm of [affected object name] has been changed from Green to Yellow.
In other words, the status of this alarm has been changed from "Normal" (Green) to "Warning" (Yellow).
The last possible status being "Critical" (Red).
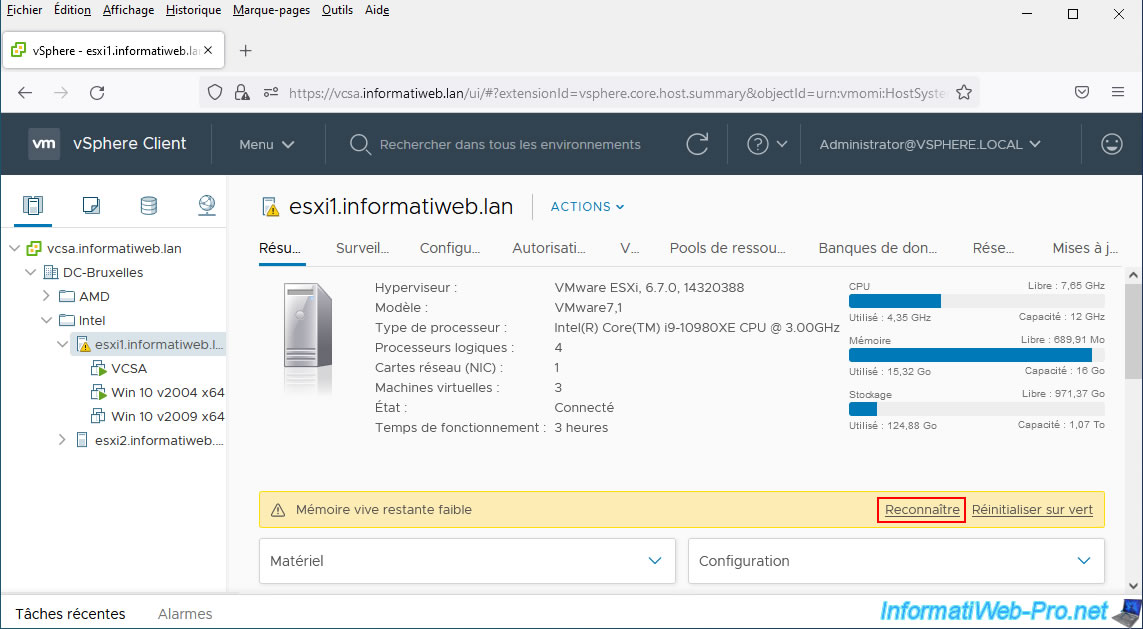
3. Recognize an alarm
When an alarm is triggered on your VMware vCenter Server, you have 2 options:
- recognize it: to temporarily hide this alarm, leaving it in "triggered" status while you correct the problem manually.
- reset it to green: to delete it permanently. Note that this does not remove the definition of this alarm, just the fact that it was triggered.
For the example, we click on "Recognize".
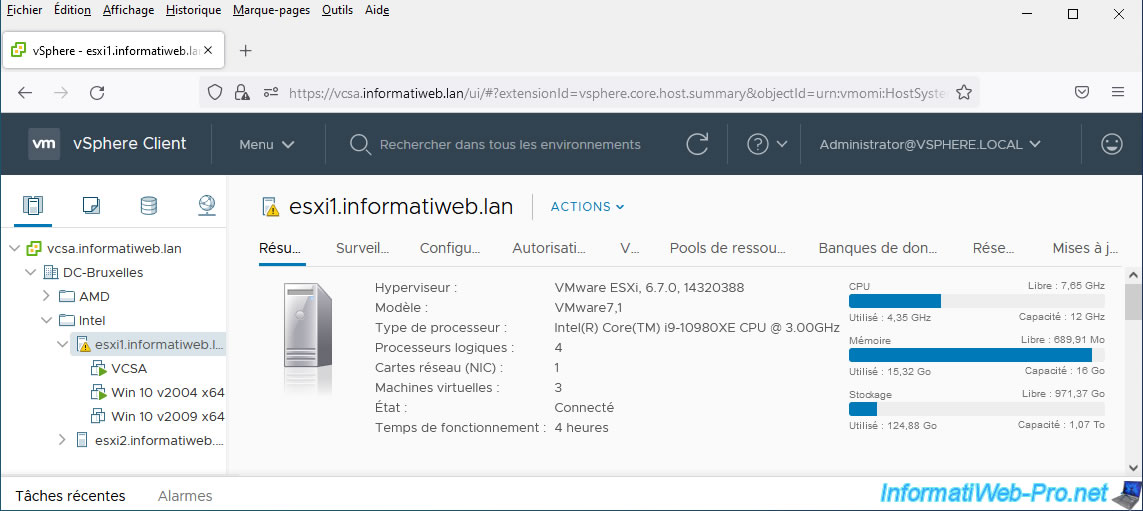
As you can see, the warning with a yellow background has disappeared, but VMware vCenter Server continues to display a yellow triangle on the icon of this object.
If you go to the "Monitor" tab of this object, then go to the "Issues and Alarms -> Triggered Alarms" section, you will see that the alarm that was triggered is still in "Warning" severity (or "Critical", depending on your case).
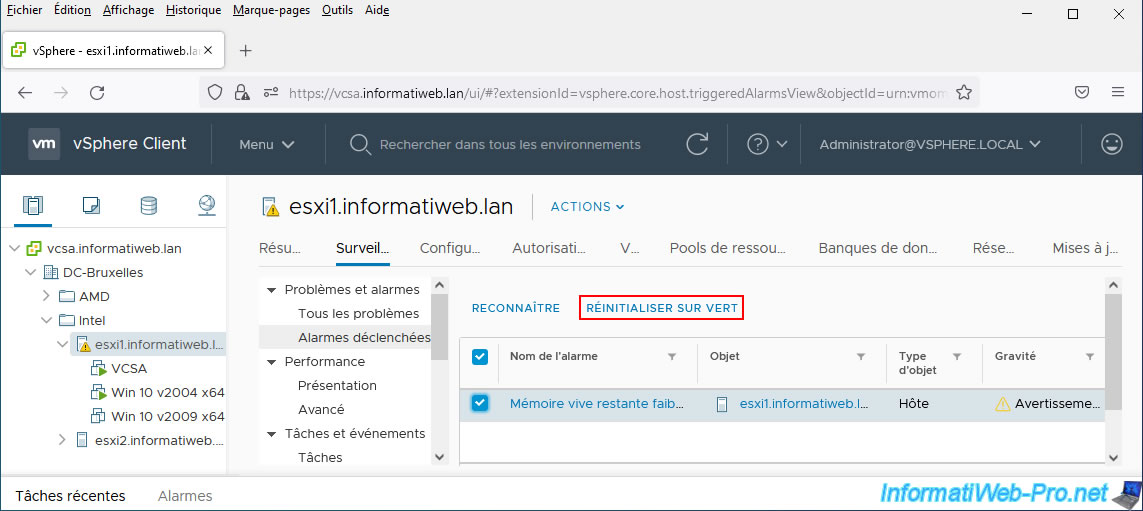
4. Reset an alarm to green
To permanently hide the triggering of an alarm, you will need to click on "Reset To Green" (green = normal status).
Since we previously clicked on "Recognize", the yellow warning has disappeared.
So, we need to go to the "Triggered Alarms" section of the relevant object to select the triggered alarm, then click "Reset To Green" to hide it permanently.
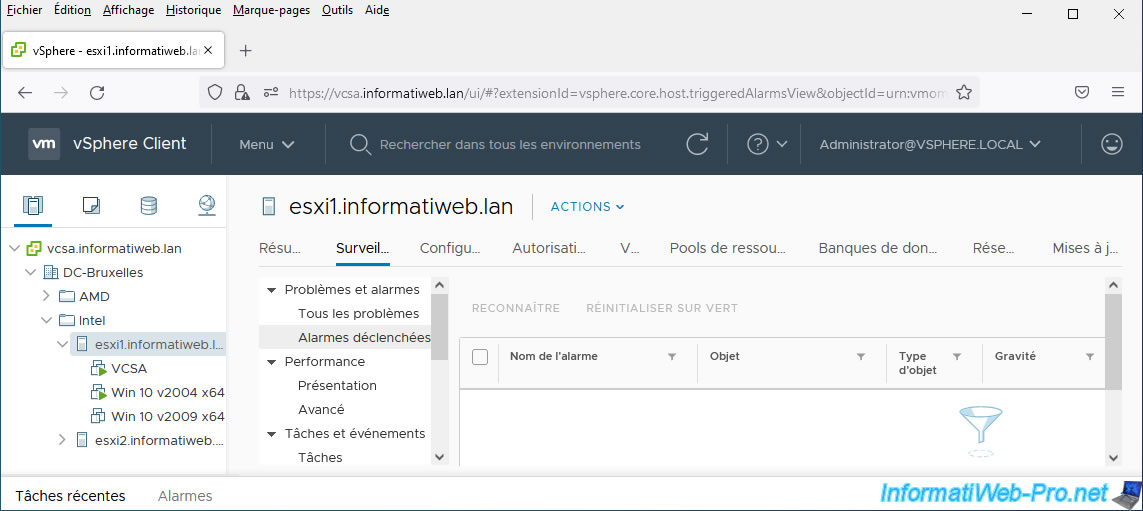
The triggering of this alarm disappears.
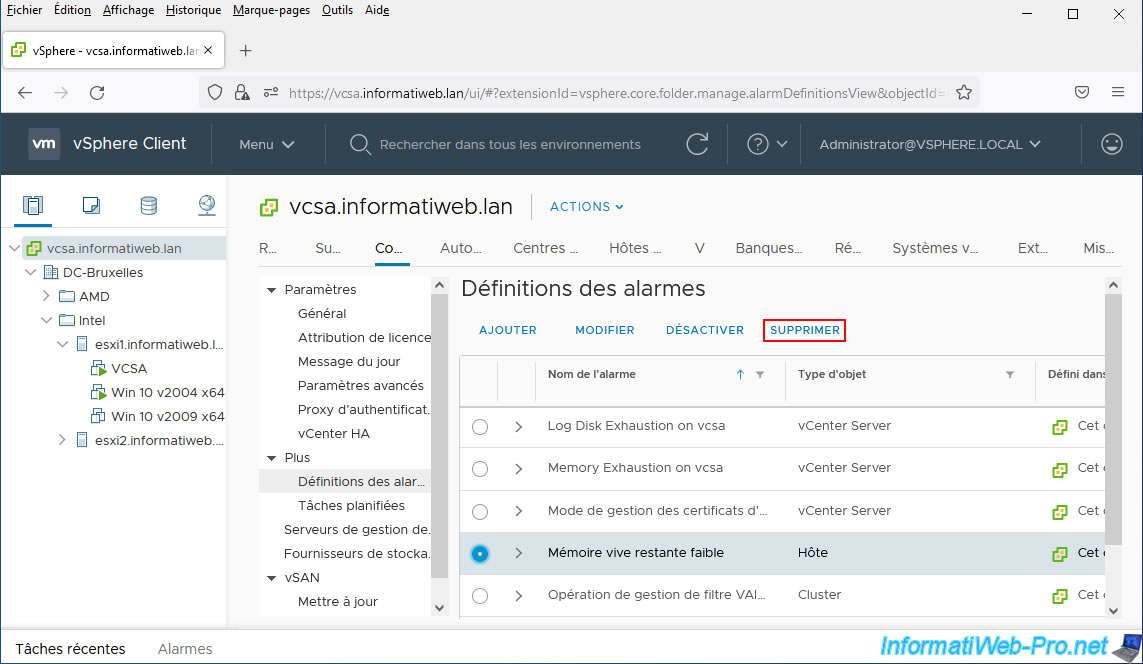
5. Delete an alarm definition
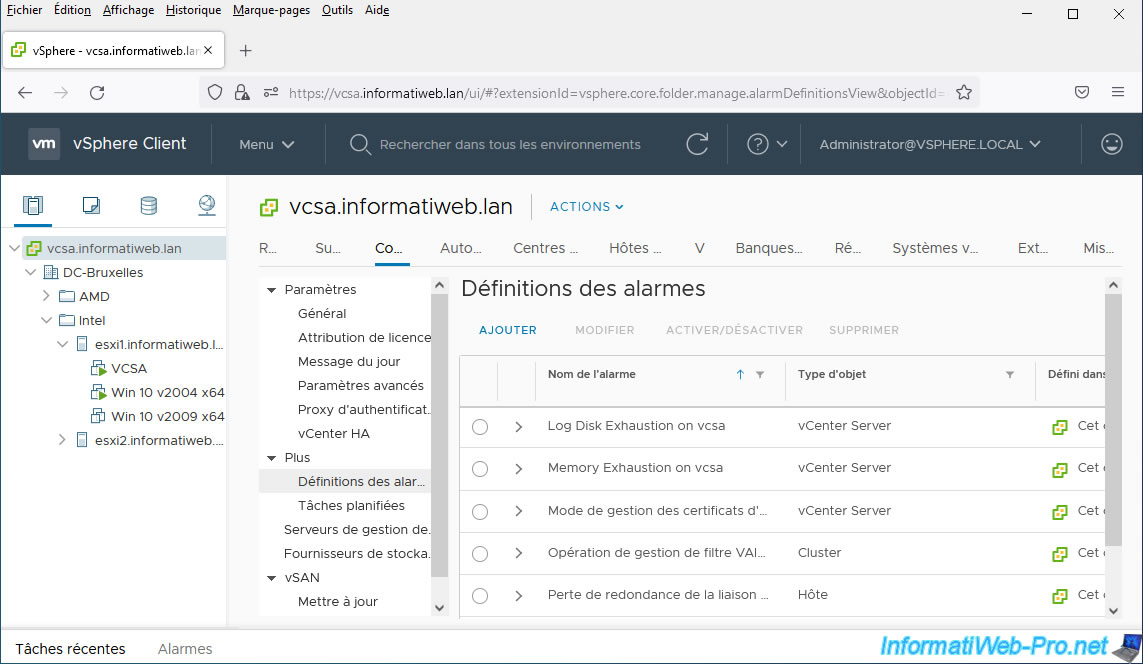
To delete the definition of an alarm, select the object where it was defined (in our case, our server: vcsa.informatiweb.lan) and go to its "Configure" tab.
Next, go to the "More -> Alarm Definitions" section, select the alarm definition to delete, and click: Delete.
Note: if the "Modify", "Disable" and "Delete" options are grayed out, make sure you have selected the object where this alarm was defined and not a child object which would be affected by it.
Additionally, make sure you have the right to manage these alarms.
Confirm the deletion of this alarm definition by clicking OK.

The desired alarm definition has been deleted.
Share this tutorial
To see also
-
VMware 3/13/2024
VMware ESXi 6.7 - Synchronize the clock of ESXi hosts from a time server (NTP)
-
VMware 3/8/2024
VMware ESXi 6.7 - Synchronize the clock of VCSA from a time server (NTP)
-
VMware 7/31/2024
VMware vSphere 6.7 - Add an Active Directory identity source
-
VMware 5/22/2024
VMware vSphere 6.7 - Change default console
No comment