- Linux
- 05 October 2015 at 14:10 UTC
-


Iptraf is a network monitoring program that allows you to analyze network traffic (incoming and outgoing) of your server, but also to analyze the traffic in your LAN.
This program will allow you to :
- detect DDOS attacks and find the attacker's IP address (unless the attacker uses a botnet for its DDOS attack).
- find who uses the most bandwidth in your network or of your Internet connection.
- detect the use of file sharing software (which are hungry of network traffic) like eMule, Bittorrent, ... *
* You can also try to block this type of program by turning your server into a router. Then, you will allow only the main ports (80: HTTP 443: HTTPS, 21: FTP, ...). This solution is not 100% sure but it will block the use of these programs by most users.
Warning : This program will not work if you use it in a virtual machine created using OpenVZ (if you have a "venet" interface, it will not work). So, this program will not work on the OVH Classic VPS.
- Install Iptraf
- Analyze your server network
- Iptraf configuration
- Overview of "Reverse DNS lookups" and "TCP / UDP service names" options
- Overview of promiscuous mode (Force promiscuous mode)
- Saving the network log (Logging)
- Include MAC addresses of network devices
- General interface statistics
- Detailed interface statistics
- Statistical breakdowns
- LAN station monitor
- Filters
1. Install Iptraf
To install Iptraf, simply install the "iptraf" package.
Bash
apt-get install iptraf
2. Analyze your server network
To analyze the network traffic on your server, run iptraf :
Bash
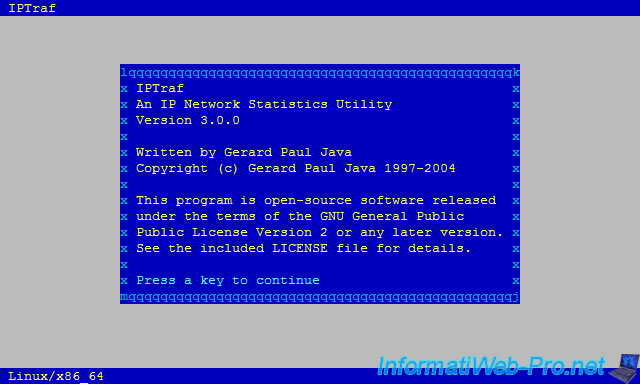
iptraf
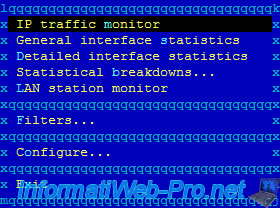
Then, select "IP traffic monitor".
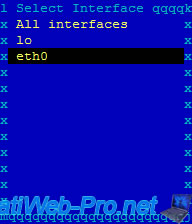
Select the interface to "listen" from the list :
- All interfaces : all network interfaces of the machine or the server
- lo (loopback) : local loop (127.0.0.1 IP address)
- eth0 : Ethernet network card (wired)
- wlan0 : Wifi network card (wireless)
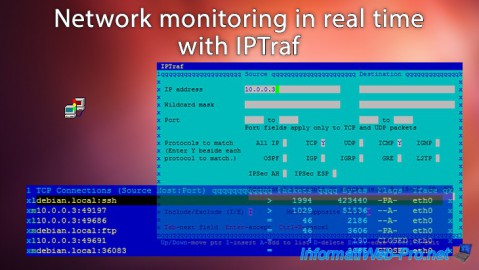
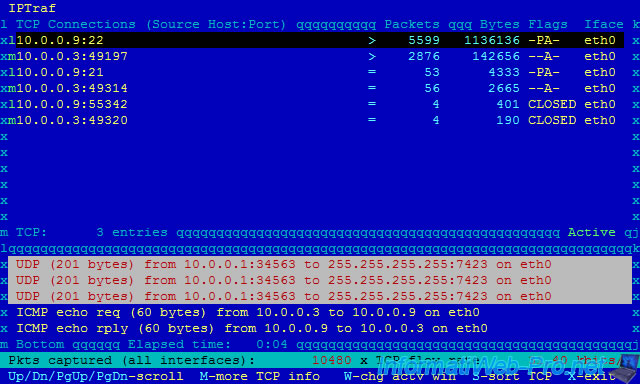
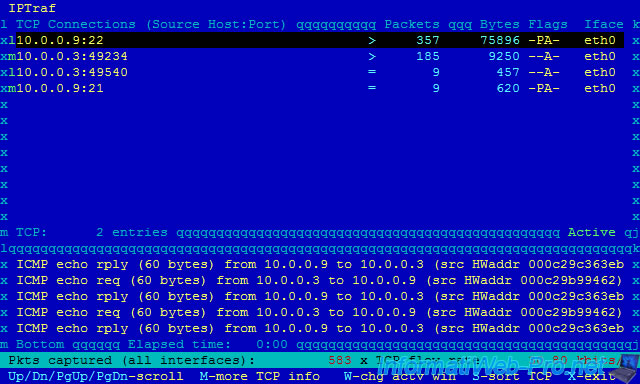
We left the program running for a few minutes to give you an overview of the program :
In the upper part you will see "TCP" connections (connected mode) :
- the client "10.0.0.3:49197" (IP : 10.0.0.3 / Port 49197) is connected to our ssh server (IP : 10.0.0.9 / Port 22). In this case, we are connected to our server in ssh. Client IP "10.0.0.3" (random port) - Server IP "10.0.0.9" (port 22).
In oder to not influence the network analysis, you should connect to your server through a network interface dedicated to the remote access. Indeed, the number of packets goes up really fast, because we receive real-time statistics through our ssh connection. So, the snake biting his tail. - this same client is connected to our FTP server (port 21) but he doesn't use it. (only 53 packets)
In the lower part, you will see the "UDP" packets (offline mode) :
- our router (IP: 10.0.0.1) spends his time to send packets to the broadcast IP address (so this packet is sent to all network machines).
- the user with the IP address 10.0.0.3 ping our server (IP: 10.0.0.9) / ICMP echo req ... And our server replies / ICMP echo rply. If the ping still comes from the same IP address, it can be the monitoring server of your hoster, or a hacker who makes a DDOS attack against your server.
Note : lines are in pairs. Ex : lines "10.0.0.9:22" and "10.0.0.3:49197" allow us to know that there is a connection between these network points. The ":" separates the port and the IP address.
3. Iptraf configuration
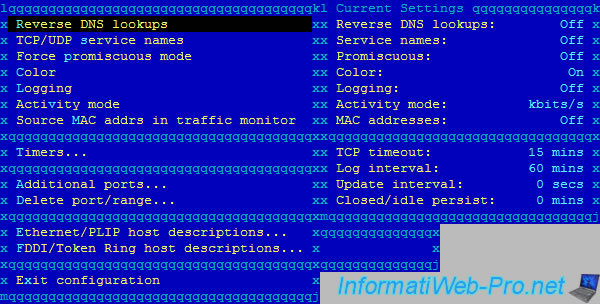
In the Iptraf menu (at the launch of it), go to "Configure".
In the configuration you can :
- Reverse DNS lookups : try to automatically resolve IP addresses into domain names.
- TCP/UDP service names : display the names of ports (eg : ssh, ftp, http, ...) instead of port numbers (eg : 22, 21, 80, ...).
- Force promiscuous mode : by default (state : Off), the network adapter accepts only packets that are destined to him or she sends. If you want to analyze all network connections (if the network equipment used permit it), you must enable this promiscuous mode.
- Color : Allows you to set the coloration or not.
- Logging : allows you to save the history of the network monitoring in a file.
- Activity mode : it is the unit to be used (kbits/sec or kbytes/s). Note : 1 byte = 8 bits.
- Source MAC addrs in traffic monitor : Allows you to display the MAC address corresponding to the source IP address in the lower part of the program.
- Timers
- TCP timeout : allows you to set the time after which a connection is considered inactive.
- Logging interval : allows you to set the time interval between two logs backups.
- Screen update : allows you to set the refresh time interval of data displayed in real time.
- TCP closed/idle persistence : allows you to set the time after a closed connection must disappear from the screen.
- Additional ports / Delete port/range : allows you to add or remove ports to monitor.
4. Overview of "Reverse DNS lookups" and "TCP / UDP service names" options
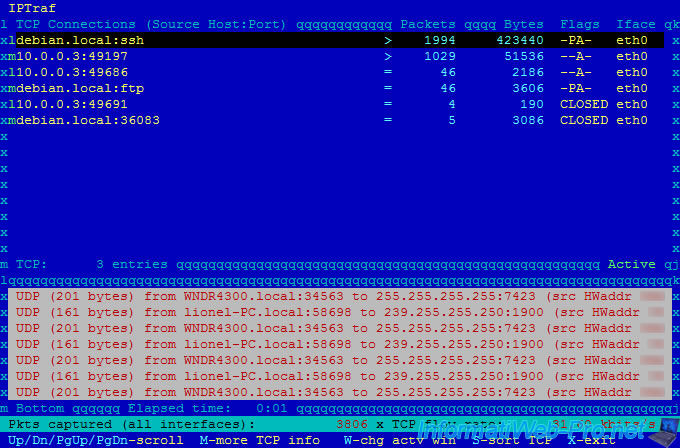
As you can see :
- our machine that had the 10.0.0.9 IP address, owns the "debian.local" domain name.
- the client "10.0.0.3" is connected to our SSH server (port 22).
- the client "10.0.0.3" is connected to our FTP server (port 21).
5. Overview of promiscuous mode (Force promiscuous mode)
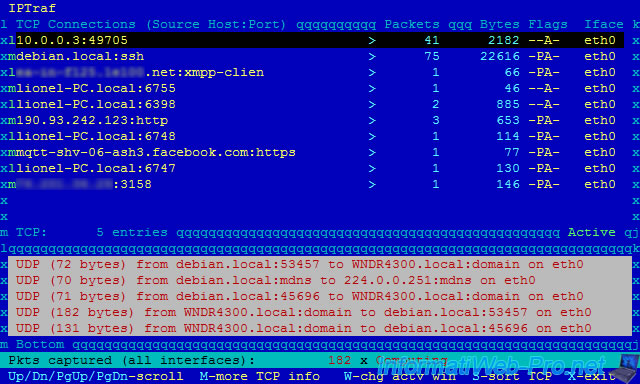
As you can see :
- there is a machine named "Lionel-PC" on the network
- the client "10.0.0.3" is connected to our ssh server
- the "lionel-PC" machine is connected to an instant messaging server running with XMPP
- the user of the machine "lionel-PC" is currently connected to the facebook server with the https protocol (port : 443)
- ...
6. Saving the network log (Logging)
If you enable the "Logging" option, the network log will be saved in real time in the file specified when choosing the monitoring type (IP traffic monitor, lan station monitor, ...).
Note : It's recommended to indicate a new path each time to avoid overwriting the previous log file.
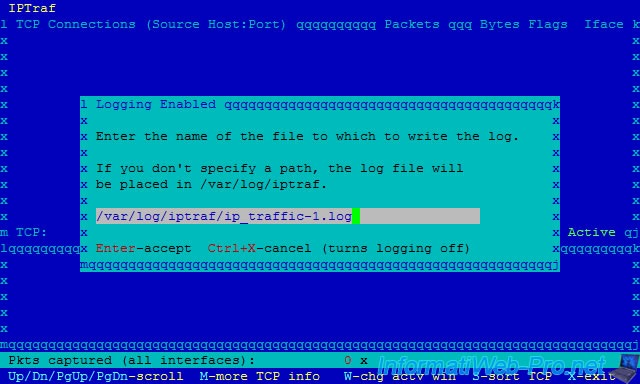
By default, logs will be saved in the "/var/log/iptraf/" folder.
Bash
ls /var/log/iptraf/
Plain Text
iface_stats_detailed-eth0.log  ip_traffic-1.log      packet_size-eth0.log
iface_stats_general.log        lan_statistics-1.log  rvnamed.log
Here are a part of IP Monitor log file (ip_traffic-1.log) :
Sat Jun  6 12:01:41 2015; ******** IP traffic monitor started ********
...
Sat Jun  6 12:18:36 2015; TCP; eth0; 52 bytes; from 10.0.0.3:49667 to debian.local:56526 (source MAC addr 000c29b99462); first packet (SYN)
Sat Jun  6 12:18:36 2015; TCP; eth0; 52 bytes; from debian.local:56526 to 10.0.0.3:49667 (source MAC addr 000c29c363eb); first packet (SYN)
Sat Jun  6 12:18:36 2015; TCP; eth0; 40 bytes; from debian.local:56526 to 10.0.0.3:49667 (source MAC addr 000c29c363eb); FIN sent; 4 packets, 3046 bytes, avg flow rate 24,00 kbits/s
...
Sat Jun  6 12:18:37 2015; UDP; eth0; 201 bytes; source MAC address xxxxxxxxxxxx; from WNDR4300.local:34563 to 255.255.255.255:7423
...
Sat Jun  6 12:18:46 2015; ******** IP traffic monitor stopped ********
7. Include MAC addresses of network devices
If you have enabled the "Source MAC addrs in traffic monitor" option, you will see MAC addresses corresponding to source IP addresses.
As you can see in the lower part, MAC addresses are preceded by "src HWaddr" (meaning : Hardware address).
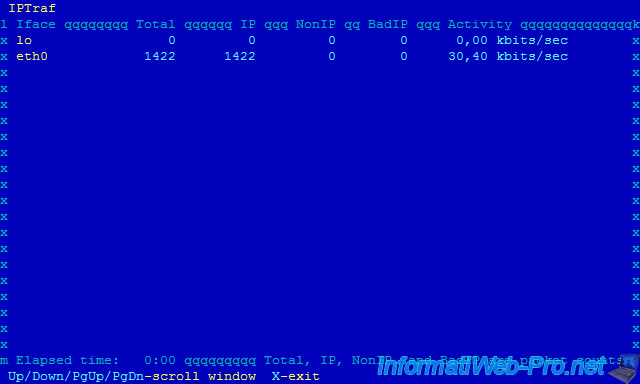
8. General interface statistics
General interface statistics allows you to get general statistics for each network interface.
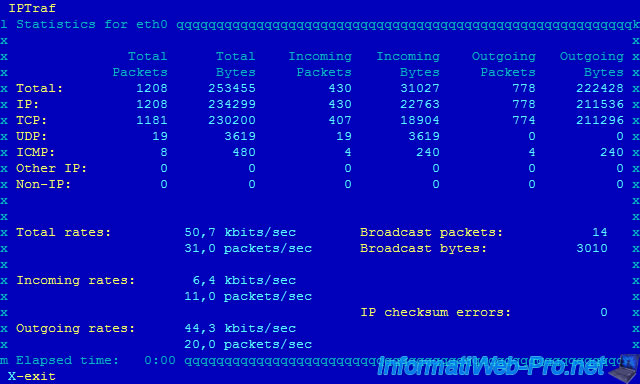
9. Detailed interface statistics
Detailed interface statistics allows you to have detailed information about the selected network interface.
10. Statistical breakdowns
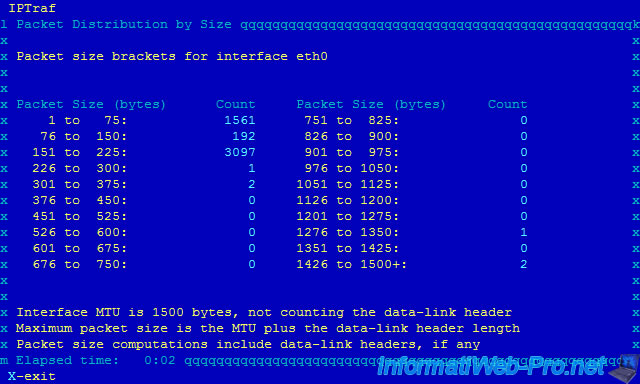
10.1. By packet size (statistics by packet size)
This function allows you to sort packets by size.
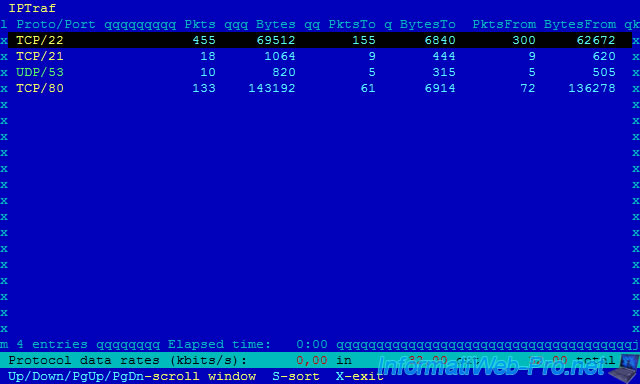
10.2. By TCP/UDP port (statistics by TCP/UDP port)
This function allows you to sort packets by port.
Thus, it's possible to see the number of packets passing on specific ports : 21 (FTP), 22 (SSH), 53 (DNS), 80 (HTTP), ...
11. LAN station monitor
LAN station monitor allows you to monitor the bandwidth used by machines on your local network.
As you can see, the program displays the MAC address instead of the IP address.
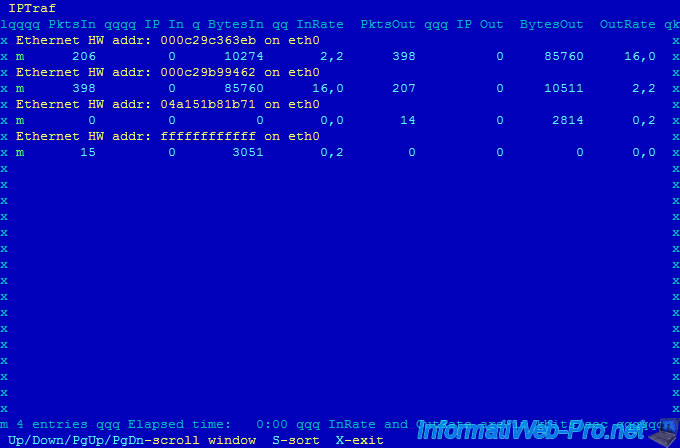
To know IP addresses that correspond to these MAC addresses, you can use the "nmap" command.
Note : 10.0.0.1 is the IP address of our router.
Bash
nmap -sP 10.0.0.1/24
This command displays a result like this :
Plain Text
Starting Nmap 6.00 ( https://nmap.org ) at 2015-06-06 12:19 CEST
Nmap scan report for 10.0.0.1
Host is up (0.00080s latency).
MAC Address: 04:A1:51:XX:XX:XX (Unknown)
Nmap scan report for 10.0.0.3
Host is up (0.0023s latency).
MAC Address: 00:0C:29:B9:94:62 (VMware)
Nmap scan report for 10.0.0.4
Host is up (0.000098s latency).
MAC Address: 78:24:AF:XX:XX:XX (Unknown)
Nmap scan report for 10.0.0.9
Host is up.
Nmap done: 256 IP addresses (4 hosts up) scanned in 10.32 seconds
To know the MAC address of your server, use the "ifconfig" command.
Bash
ifconfig
In the information displayed, you will see the line :
Plain Text
eth0 Link encap:Ethernet HWaddr 00:0c:29:c3:63:eb
12. Filters
Filters allow you to monitor network traffic according to :
- the source IP address and / or the destination IP address
- the source and / or destination port(s). (Eg : 80 and 443 for the web, 21 for the file transfer (FTP), ...)
- protocols (TCP, UDP, ICMP used for by the ping command, ...)
The filter configuration can be used to include or exclude network traffic of the real time history.
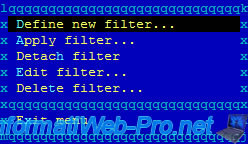
To create a filter, go to "Filters".
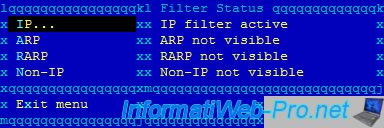
In our case, we'll use a "IP" filter.
Note : As you can see, currently, there is no IP filter active.
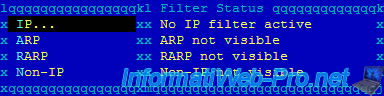
Select "Define new filter".
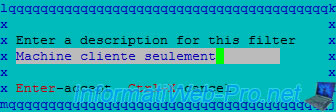
Specify a name for this filter.
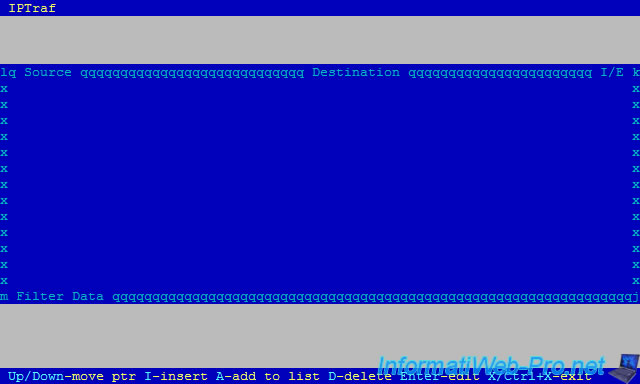
For now, there are no settings for this filter.
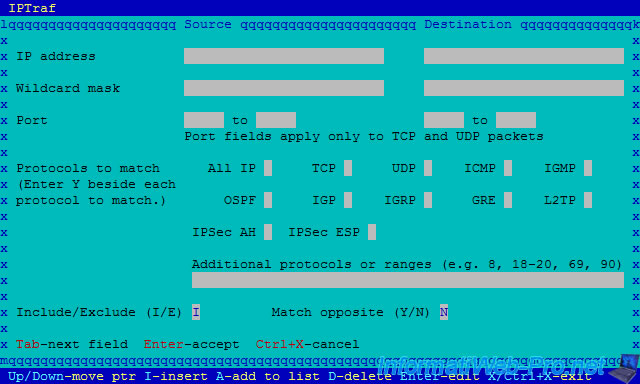
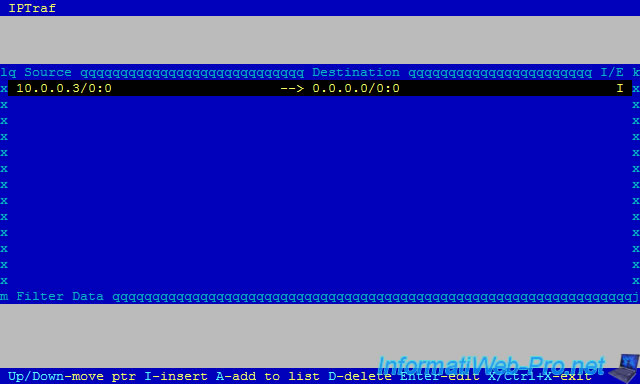
To add one, press "i" (for the insert option).
For this tutorial, we will only analyze the traffic :
- having "10.0.0.3" as source IP address
- using the TCP or ICMP protocol (to detect possible DDOS attacks using the ping)
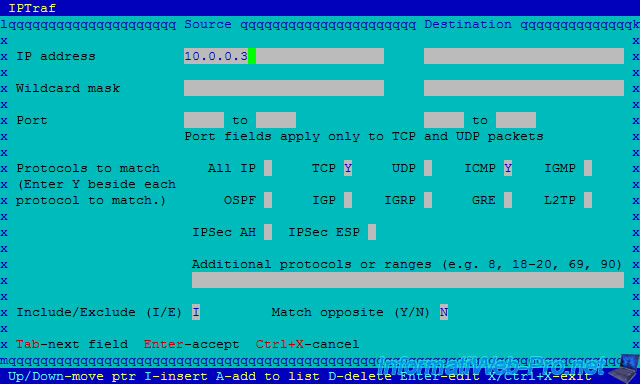
If you wish, you can add other settings for this filter.
Then, leave the window by pressing "CTRL + X".
Select "Apply filter".
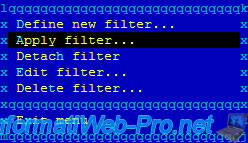
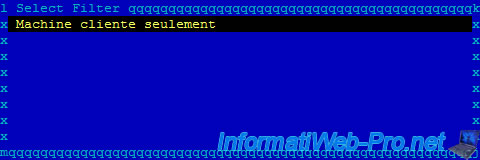
Select the filter to be applied and press Enter.
As you can see, now, the IP filter is active.
In our case, we'll use "IP traffic monitor".
On our machine "10.0.0.3", we used :
- a FTP client to connect to the server (IP: 10.0.0.9)
- the ping command to ping our server. (ICMP echo requests displayed the bottom)
Share this tutorial
To see also
-

Linux 10/11/2016
Debian / Ubuntu - Configure an iSCSI server and an iSCSI client
-

Linux 10/2/2016
Install and use the LVM on Linux
-

Linux 1/15/2014
Ubuntu - Configure a LDAP server and a web interface to manage it
-

Linux 2/14/2014
Ubuntu - Securing your LDAP server with SSL
You must be logged in to post a comment